TS Custom Analysis is precise support and resistance based custom technical analysis in the style of TS TradePlan. Analysis can be done for markets specified by clients. Email TraderSmarts today for a free quote.
Several studies have found a connection between full and new moons and stock market performance. Knowing how and when to time the cycles in trend shifts is centuries old, but new to most traders.
Cutting-edge NinjaTrader 8 Risk Reward Indicator empowers you to make informed decisions with unparalleled precision. Effortless extension, tailored risk levels, adjustable aesthetics, with free 14 days trial and 24/7 support line.
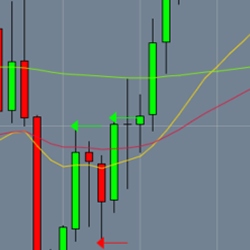
One minute chart entry indicator after a trend reversal on the 5-minute chart. The indicator looks for the first entry after hitting the 20EMA, and a W bottom or M top depending on the direction afterward. All that is needed is a 20EMA on the 5-minute, and a 20EMA and 200EMA on the one minute.
Fibonacci LevelsL Institutional Support and Resistance Levels by DTB Traders offer unparalleled accuracy for futures market trading. With automatic adjustments for new highs and lows, save hours on analysis across multiple instruments and time frames.
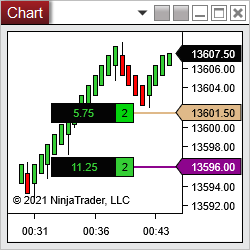
The Breakeven Price indicator shows the breakeven price as a graphical display directly on the chart. It is a must-have for scalpers to scale in/out of positions and keep track of PNL. SuperDOM/Market Analyzer PNL columns & an indicator with a dynamic stop loss order are included. 7-day free trial.
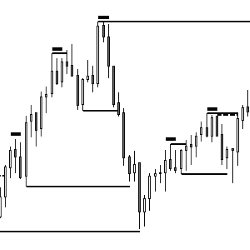
This indicator shows Double Bottoms and Double Tops which are tested by subsequent price action. It shows micro Double Bottoms & micro Double Tops as well. Use it as a discretionary indicator and for automated trading (e.g. BloodHound). Get started with a free 20-day trial today!
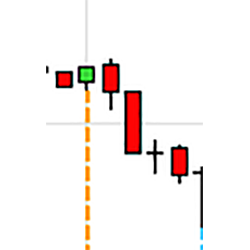
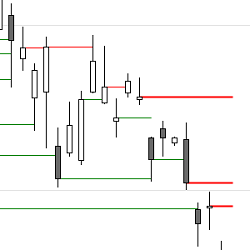
On instruments with regular trading hours you often see gaps on a chart which stay open for more than a day. A couple of times a month these open gaps from prior days also play an obvious role as support or resistance on the intraday chart. These tools are free to download and use!
Education that includes beginner, candlestick analysis, how to place a trade, stair stepping, Fibonacci retracements, Fibonacci extensions and more.
The BG Levels indicator displays institutional buy and sell levels - where the “smart money” is buying and selling - and where they are exiting. The premise is to buy at a cross of the Level Up line (to the upside) and exit your long position at the Target line (to the downside).
December 2, 2024
Mastering Sideways Markets With Auction Bars and Range Projections
November 19, 2024
Enhancing Your Automated Trading System: Key Insights from Best Pro Trade
November 14, 2024
NinjaTrader New Ecosystem Tools: October 2024 Edition
Enter Email for Updates