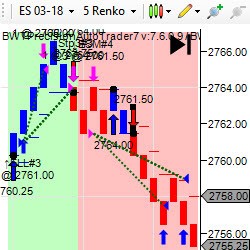
BWT Precision Autotrader - by Blue Wave Trading Algorithmic Research and Development
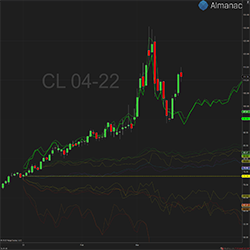
Almanac™ CalendarAnalytics for NinjaTrader 8 - by Accrue Inc.
RTMC MNTrader - by AMNTrader
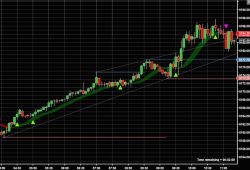
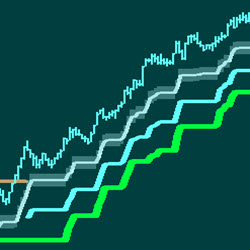
Cosmik Z-TP: Trend-Following Trading System for Effective Pullback Trades, Support/Resistance Analysis, and Momentum Insights - by ninZa.co

ATR Stop (Average True Range) - by Polaris Trading Group
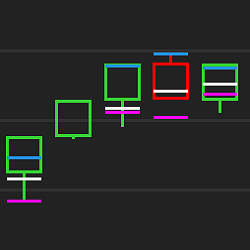
TDSDeltaAuto - by TradeDevSystem
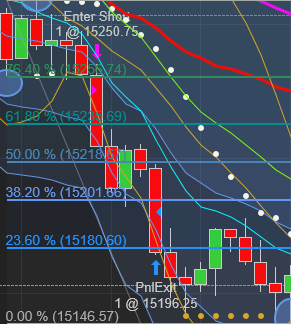
OtterBot NQ - by Otterbot
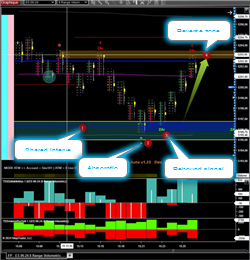
Scalping with Orderbook & Tape (FR with EN subtitles) - by OF Course Trader

Optimal Tempo - by Optimal Ninja
Trend Support and Resistance Plus High/Lows Forecast Lines - by AEP-International