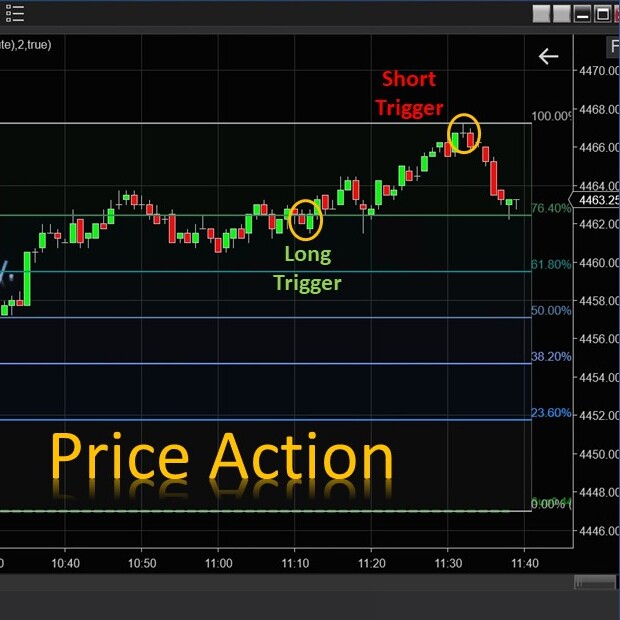
The E.G. Price Action - by E.G. Indicators
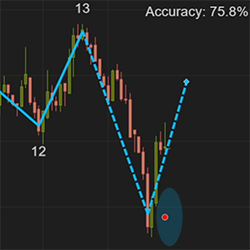
AiWave - by AiTrading.Tools
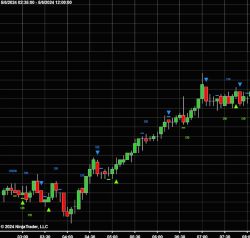
Reversals and Pullbacks Located by: The Turn Around Signal - by AEP-International
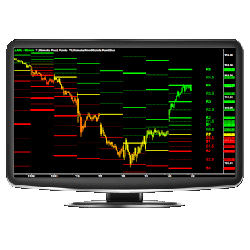
Mpace - by MBoxWave
Bollinger Bands Suite - by Indicator Warehouse

B.I.T.S Indicator - by Trade The Fifth
Ultimate Pivot Points™ (UPP) - by Fibozachi
Composite Index Divergence - by Trading Indicators
ApexAlgo - by ApexAlgo