Download and Use Best FREE Indicators for NinjaTrader 8 - by Rize Capital Ltd

ATR Projections - by TREMPER.com

B4 CoPilot - by B4 Signals
BarSizeCounter - by TickTec

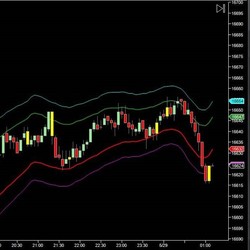
DTB Ultimate Bands - by Dynamic Trading Bars
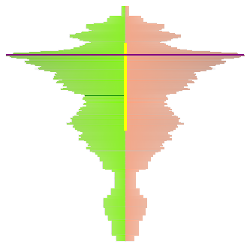
TC_BarProfiler - by TradingCoders
Drummond Geometry Charting Software - by Drummond Geometry
Free Room - by NaviTrader, Inc.

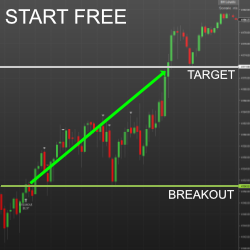
FREE Trading Course - by Sistema EPyF

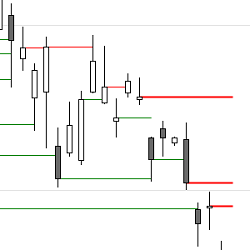
Price Action | Support and Resistance – Open Gaps - by PriceActionIndicators.com