Entry Signals from TREMPER.com generates entries based on proprietary internal conditions. It allows you to manage your position based on chart size and your parameters.
Price Action Harvester™ scans all markets to find consistent price action patterns based on historical data. Know how price moved for any instrument on particular days, during particular time-frames. A powerful tool for day traders. Don't miss this indicator!
Day Trading Radio is a live online market broadcast led by John Kurisko, a full-time trader of nearly 25 years. The show kicks off every morning around 8:30 am (EST) with live trading and technical analysis of the markets in real time. Get trade alerts and trade with 100’s of traders every day.
Forex Trading Unlocked Online Trading Mentoring provides focused consulting to suit each individual trader’s needs. Forex, futures, stocks, options, and binary options traders can all benefit. Your trading will be placed under a microscope to help eliminate what is holding you back.
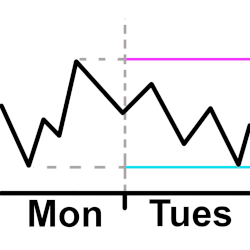
Plot a horizontal line for the high and low from the previous intraday. The user configures the open and close time they want to use for the intraday hours. This means the user can plot the high and low starting 30 minutes before the actual open and after the actual close if they want to.
Our Partner Programmer service is ideal for traders with great ideas and a limited budget. We help code your ideas and instead of paying for the programming service, we enter a joint investment agreement.
Learn a battle-tested strategy for trading the markets in under 60 mins per day. Here’s just a fraction of what you’ll learn: How professional traders find good trades, how to read the markets and a market that has unique advantages over others.
StockAlgo is a cutting-edge trading signal app tailored for NYSE stock traders, delivering accurate signals for NYSE stocks. Benefit from a 3-day free trial to test its reliability. Available on both iOS and Android, StockAlgo equips traders with timely insights to make informed decisions.
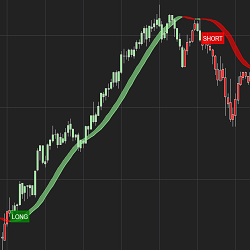
The HolyGrail Algo uses calculations of the Hull Exponential Moving Average to identify market direction. A long or short condition is printed on the chart and the strategy executes the trade by going long or short. You can set defined take profit, stop loss and trail and time of day to trade.
The Helix strategy is the combination of our Entry Zone indicator and the Trade Management strategy, hence the name Helix (or double Helix). Helix allows you to create your Entry Zones based on your setup rules. Then, after trade execution, Helix will manage the trade based on your rules.
December 2, 2024
Mastering Sideways Markets With Auction Bars and Range Projections
November 19, 2024
Enhancing Your Automated Trading System: Key Insights from Best Pro Trade
November 14, 2024
NinjaTrader New Ecosystem Tools: October 2024 Edition
Enter Email for Updates