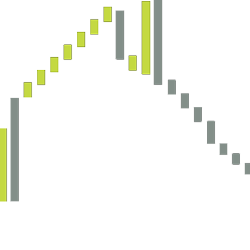
If you've never considered support and resistance from the perspective of volume – think again. Light volume regions indicate price action passing through and a great signal for continuation of trend. High volume suggests a pause point. Just what you need to know in advance. So, grab yours now!
This comprehensive program begins with the Basics of Trading, where you'll learn fundamental concepts, market structures, and essential terminologies. Progressing to the Intermediate Strategies module, you'll dive into technical analysis, risk management, and trading psychology.
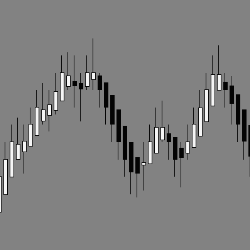
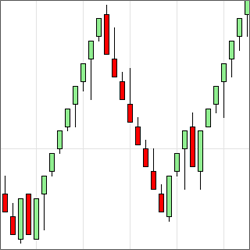
The LogikRenkoStreamline is an improved variant of the traditional Renko Bar type. By granting the ability to set the Reversal Brick size, the bar type will minimize spurious reversal whipsaws.
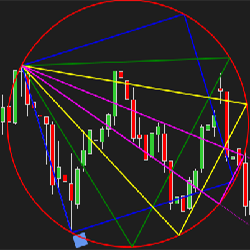
We are pleased to bring NinjaTrader users this tool typically reserved for expensive institutional platforms. The Gann Emblem is a drawing tool for those familiar with its applications, especially traders of the Gartley method.
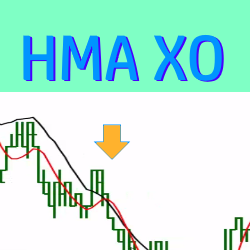
This trade setup indicator paints entry signals each time a Hull Moving Average (HMA) crossover occurs. The entry signals are customizable and can be filtered by the slope of the linear regression. Click here to watch a video and lean more!
All-in-one solution for futures traders, including powerful order flow reversal signals, daily trading plans, live morning voice chat/trading, in-depth courses on our strategy and the mental aspects of trading. It's everything you need in one place to develop your skills.
EPyFBarsType is a tick-based bar, unlike time-based bars such as regular Japanese candles. These bars are one of the main components of our system, due to the objectivity they provide for technical analysis. This bar type helps in identifying market moves and avoiding choppy areas.
Unlock the power of fully automated NQ and MNQ futures trading with Steady Turtle. This advanced trend-following strategy adapts to market momentum and volatility, offering precise, emotion-free execution with robust risk management.
Market Delta Volume Profile is designed to distinguish if buyers or sellers are in control & to see breakdown of volume in each bar. It’s used to identify price reversal areas and look into the price action of each Renko bar to view volume profile, price & monitor order flow.
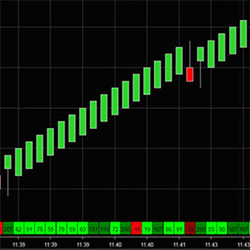
The Lucrum Vision Renko Bar reflects the actual price of the underlying instrument so you can be confident in its ability to accurately represent true price. Get accurate Renko charting for both live and backtested trading environments.
December 2, 2024
Mastering Sideways Markets With Auction Bars and Range Projections
November 19, 2024
Enhancing Your Automated Trading System: Key Insights from Best Pro Trade
November 14, 2024
NinjaTrader New Ecosystem Tools: October 2024 Edition
Enter Email for Updates