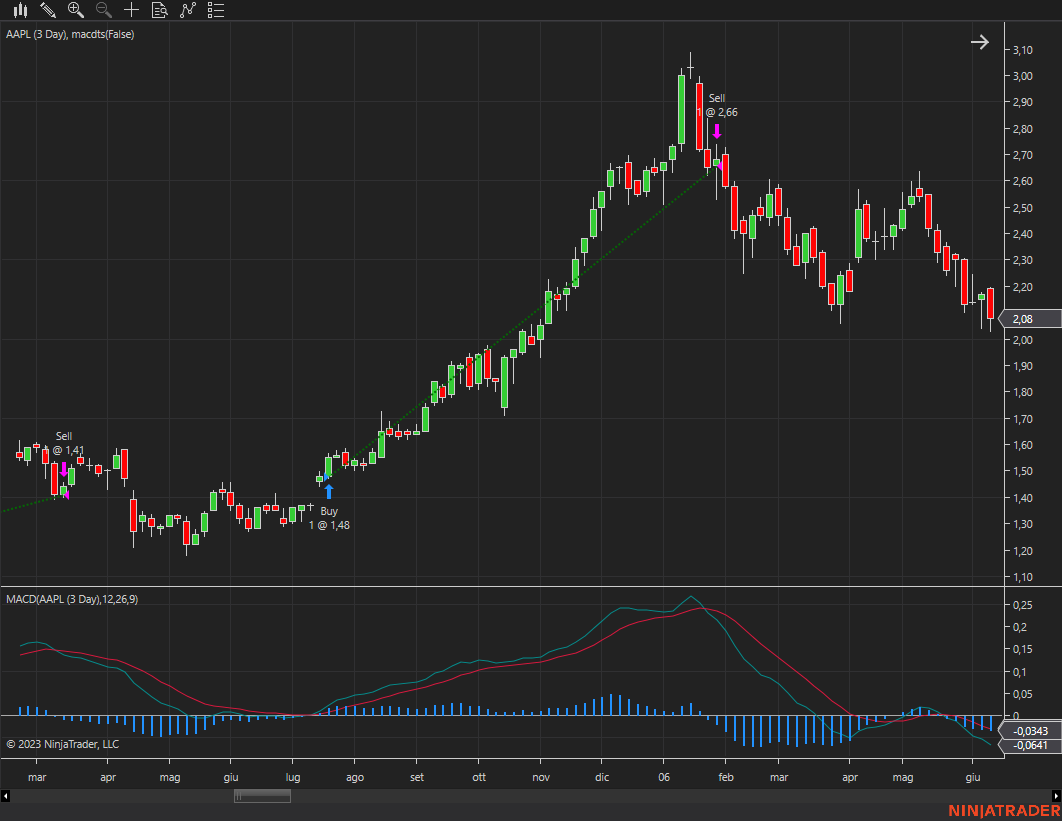
Trading system based on the MACD indicator, exploiting breakouts and trend persistence.
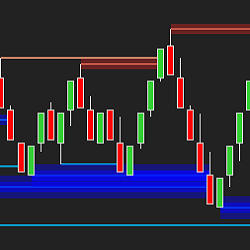
The Volume Vector tool creates automatic volume profiling of price action swings. Increase trading consistency and see exactly where trades have been initiated!
Easy Trader is a complete trading system and offers many options. The display is easy to read and use. When a signal fires, an arrow is plotted and can be used with our ATM Entry Assistant. Easy Trader is our oldest product, has been in use over the past twenty years, and it still works.
Ichimoku MNTrader is a fully automated trading system. Trading is based on the Ichimoku Kinko Hyo indicator, patterns and zigzag to filter out false signals and build more accurate analysis. It uses Renko charts and is suitable for all futures and Forex trading instruments.
Creating custom algorithmic trading solutions that provide out of the box edge.
ThunderZilla is a user-friendly trading system designed to enhance your pullback trading. It integrates essential features for a well-rounded approach, including trend identification, entry signals, stop placements, targets, and trailing stops.
Trend Action Trader keeps you on the right side of the market with clear high probability signals for all markets and timeframes. Its price patterns and momentum algorithm are ideal whether you trade short or long term. Improve your trading consistency - try risk-free for 30-days!
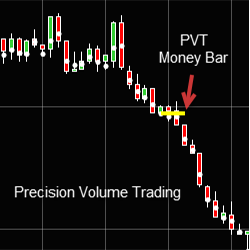
Precision Volume Trading Money Bar lets the trader know if it is half of the current move or the market is reversing.
Easily track swing highs and swing lows in multiple timeframes across your chart. Simply define your three swing strengths and Optimal Levels uses heatmap graphics to plot those key levels until they are touched. Strategy Builder compatible!
Kase StatWare indicators are self-optimizing, and dynamically adjust to market volatility across multiple bar lengths. StatWare’s momentum based indicators identify trend direction and strength, precise entry and exit points, and optimal stop levels to control risk. Take a free 30-day trial today!
December 2, 2024
Mastering Sideways Markets With Auction Bars and Range Projections
November 19, 2024
Enhancing Your Automated Trading System: Key Insights from Best Pro Trade
November 14, 2024
NinjaTrader New Ecosystem Tools: October 2024 Edition
Enter Email for Updates