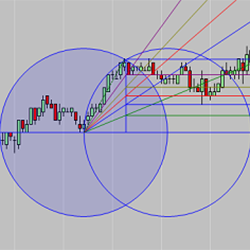
Attention Fibonacci, support/resistance, Gann & market structure enthusiasts! The HarmonicFan draws an A-B line & 2 intersecting arcs are calculated. The upper or lower half of the resulting Vesica Piscis formation is then divided into Fib levels & trend lines are then created as a fan. Learn More!
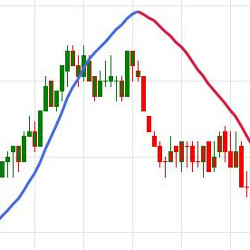
TC_TrendingTSF is a ‘smarter’ time series forecast line - a type of Linear Regression. By measuring the slope of the line, and the position of the line compared to price, this indicator can quite neatly reveal the current trend - even during sharp retracements. Free to download and use!
Introducing a groundbreaking "Future Signal Zone" concept, the system predicts Support/Resistance zones ahead of the present price. With compatibility across different chart types, ZoneGPT * From The Future assures adaptability, addressing both trend riding and pinpointing reversals.
This is a basic but powerful email training course aimed at newbies who want to get started in the world of trading and need a solid base of knowledge to help them survive the early stages of this business and increase their chances of success.
The Wealth Builder’s Roadmap is a step-by-step process divided into distinct phases. The five Ps featured in The Wealth Builder's Roadmap cover each essential pillar needed for a rock-solid trading plan. The coaching program includes online training and one-on-one follow up sessions.
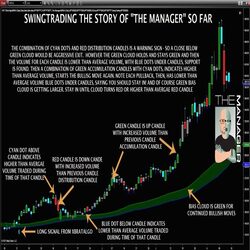
The Manager helps with simple and repeatable trade management. Using a number of tools like average volume, volume distribution or accumulation and an adjustable BIAS cloud, it can help you evaluate whether the market is reversing or just pulling back.
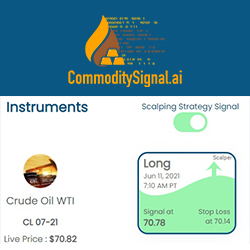
CommoditySignal.ai is an AI-powered Robo Advisor! Trade energy, metals, and agro commodities futures like crude, gold, and silver with an AI algorithm's expertise. Additional features like newsroom and chatroom keep you updated on the latest trends. Free forever - no need for a credit card!
Simplify your trading & save monitor real-estate with the TradeFinder Market Analyzer Add-On. This tool drills-down to dissect & monitor multiple markets, timeframes & instruments to spot trends, momentum & price action in real time, complete with pop-up, email & audible alerts! Learn how!
This fully-automated reactionary price and volume intraday trading strategy takes advantage of fluctuations of price, direction and momentum to currently trade the E-mini indices. We will be expanding into other futures, commodities and chart intervals in the near future.
The indicator illustrates volume delta for each bar, emphasizing the contrast between buy and sell volumes. With compatibility for historical and real-time data, it offers diverse display modes. Importantly, users can filter volumes to uncover distinctive behaviors among specific trader groups.
December 2, 2024
Mastering Sideways Markets With Auction Bars and Range Projections
November 19, 2024
Enhancing Your Automated Trading System: Key Insights from Best Pro Trade
November 14, 2024
NinjaTrader New Ecosystem Tools: October 2024 Edition
Enter Email for Updates