Free trading psychology masterclass. Learn the complete trading psychology system to overcome destructive trading habits and reach pro-level consistency in as little as 8 weeks (even if you are starting with zero willpower and breaking your rules every time you trade). Register today!
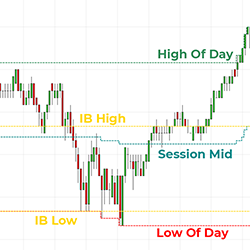
Initial balance, session mid & day mid are common market profiling levels used in day trading futures, stocks & ETF’s. This indicator automatically plots and updates these levels on any intraday chart, providing clear targets for trade entries & exits. Get started now and enhance your charts!
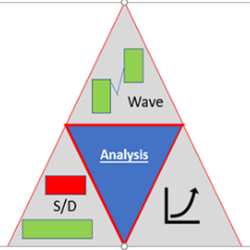
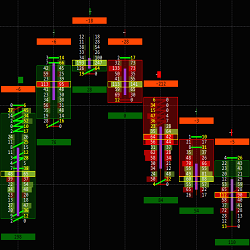
The Wave Software Package consists of three indicators: AomBBWaves- Breaks Chart into Bullish / Bearish Waves; aomSDZones - Draw Supply/Demand zones; and aomManualStrategy- Place Orders based on proprietary Signals. Complete system from analysis to order placement! Request a demo now!
Learn a battle-tested strategy for trading the markets in under 60 mins per day. Here’s just a fraction of what you’ll learn: How professional traders find good trades, how to read the markets and a market that has unique advantages over others.
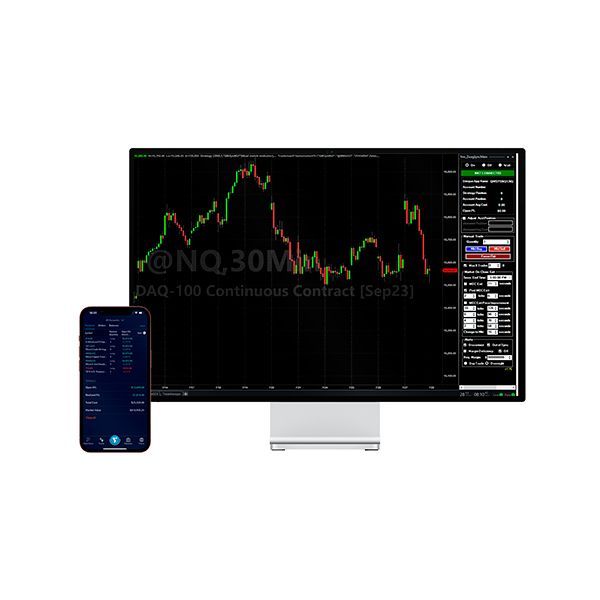
With these trader support plans you will have everything you need to carry out your operations in a professional way. They put at your disposal the latest technology on algorithmic trading. Proven software used by professional traders.
The Advanced Trading Couse focuses on teaching traders how to use order flow based tools for trading the futures, forex and equities markets.
This innovative tool from candlestick guru, Steve Nison, instantly finds his favorite candle patterns on charts. The Nison Candle Scanner works on all asset classes. Traders save hours of research time, spotting candlestick pattern opportunities immediately. Choose a monthly or lifetime purchase!
Gain an understanding of trading: market analysis, technical analysis, fundamental analysis, indicator trading, day trading/scalping, strategies, trading psychology, expectation and mindset, money management and risk management. Practice on a demo account. Referring trading brokerage/platform.
At ProlongWealth Trading, they offer a gateway to the Futures Prop Firm industry through tailored recommendations, exclusive discounts, and comprehensive YouTube education.
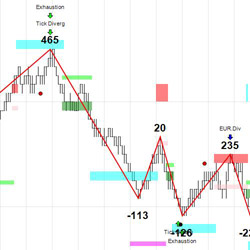
ZoneTraderPro features unique support and resistance zones to match known market trading patterns along with intuitive real time tools to identify trade entries and exits. Nothing ever disappears from a ZoneTraderPro chart so you can create and test trading strategies.
December 2, 2024
Mastering Sideways Markets With Auction Bars and Range Projections
November 19, 2024
Enhancing Your Automated Trading System: Key Insights from Best Pro Trade
November 14, 2024
NinjaTrader New Ecosystem Tools: October 2024 Edition
Enter Email for Updates