Watch price action at daily support and resistance levels in real time! Use the hourly open and EMA 20 as dynamic support and resistance. Detect reversals, trend attempts and breakout setups on the first three bars of the day. Get started with a free 30-day trial now!
The iCinDER™ MF (Market Forces) includes all of the iCinDER™ family of indicators as part of a complete set. The analysis is based on internal market force of the instrument being analyzed. Learn more!
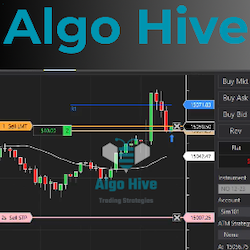
We know how it feels to have your emotions overcome your logic the moment you enter a trade. That's why we, with 15 years in software automation and day trading, created a powerful bot for ourselves... and for you! Package includes 13 custom indicators and strategies. Download your free trial today!
DTB River is an implementation of DTB Waves on non-time based charts and the results are plotted on time-based charts. It provides an added layer of noise filtering for waves. During the consolidation phase DTB River flattens out.
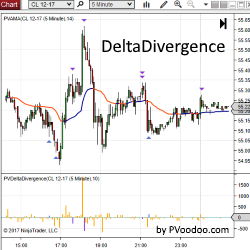
PVDeltaDivergence Indicator is a powerful tool designed to help traders identify possible turning points in their favorite markets with order flow analysis. Get a free trial of PVDeltaDivergence for NinjaTrader today!
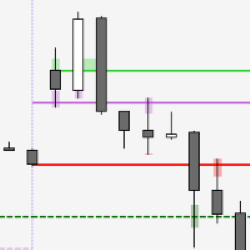
If you've never considered support and resistance from the perspective of volume – think again. Light volume regions indicate price action passing through and a great signal for continuation of trend. High volume suggests a pause point. Just what you need to know in advance. So, grab yours now!
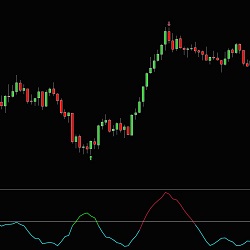
Peaks is a powerful market indicator meticulously designed to identify precise tops and bottoms of price movements. Using sophisticated analysis techniques it pinpoints potential reversal points in the market. Peaks empowers traders to optimize entries & exits, making trading decisions confidently.
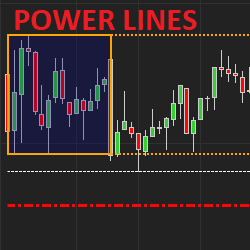
The itcPowerLines indicator displays important intraday support/resistance levels for stock traders (Opening range, morning H/L, yesterday H/L, Weekly H/L, daily SMA/EMA). Colors, styles & width are customizable. Users can also define which elements to display including levels for past days.
BurstAlgo is a straightforward and efficient automated trading tool designed to trade prop-firm accounts. It's built to preform up to three trades daily, focusing on consistent trading. This algorithm is all about keeping things practical.
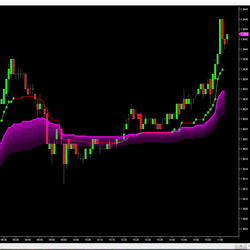
The Job Pivot is a volume profile analysis that allows the user to gauge a directional bias with price targets. It provides an equilibrium between buyers and sellers for the purpose of identifying control of the session’s auction.
December 2, 2024
Mastering Sideways Markets With Auction Bars and Range Projections
November 19, 2024
Enhancing Your Automated Trading System: Key Insights from Best Pro Trade
November 14, 2024
NinjaTrader New Ecosystem Tools: October 2024 Edition
Enter Email for Updates