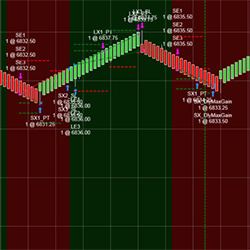
Trading123 AutoTrader is a fully automated trading algorithm that has been programmed to identify the trend. It includes entries, exits, profit targets, trailing stops plus profit & stop loss management. Designed to trade the futures markets, trend reversals and remove human emotion from trading.
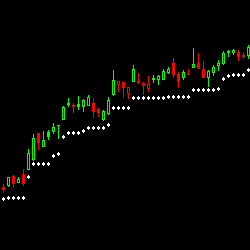
Based on ATR our Trailing Stop indicator has been designed to take all the hassle out of calculating and re-calculating your ‘stop losses.' It does this for you automatically. It also alerts if your stop is hit. A must for day and swing traders.
ForexAlgo is a powerful trading signal app designed for Forex traders, offering precise signals for Forex pairs. Enjoy a 3-day free trial to experience its accuracy and effectiveness. Available on both iOS and Android, ForexAlgo empowers traders with timely insights.
One-stop software for beginner & advanced traders. Proprietary intra-day structure & logic. Advanced time & price signals, custom built for ES, NQ & RTY. The markets opened 100 years ago with the same day timespan as today. See a NinjaTrader webinar free at DMIC2059.com. Use code NTW for a discount.
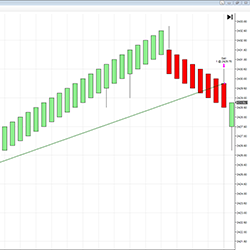
The BuySide Global Auto Trader is a state of the art automated trading system monitoring software recognition of Institutional Buy and Sell programs. The system is universal and will work in any liquid market and many timeframes. Learn more!
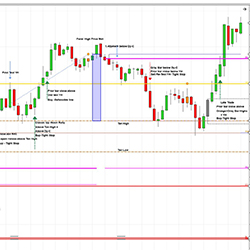
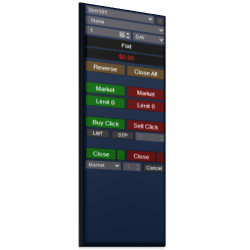
The Close Bar Entry Orders module initiates logic to submit orders immediately on the close of a bar. All orders are submitted using the account, quantity, and ATM strategy controls in the Enhanced Chart Trader. This removes unnecessary stress and challenge from entering orders when a bar closes.
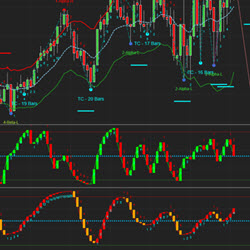
The Tradesight Seeker and Comber tools for NinjaTrader use a specific bar counting approach to measure exhaustion points. The tools work on all charts and in the Market Analyzer in NinjaTrader.
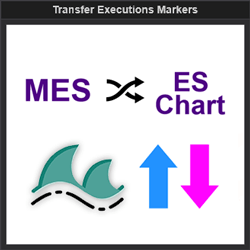
This indicator allows the user to obtain execution data from one instrument and overlay it on another. This increases application functionality and charting efficiency.
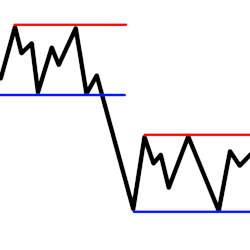
Created to help aid momentum-style charting in finding support and resistance lines. It was specifically made for the ES when plotted with tick bars. This tool may help cut down on chart preparation time or get your chart caught back up if busy multi-tasking.
Automatic Cycle Bands, GANN Fan and Fibonacci plotting. Improved double smooth Stochastics, double smooth averages indicators – trend analysis / reversals, 3 volume delta indicators. True average price.
December 2, 2024
Mastering Sideways Markets With Auction Bars and Range Projections
November 19, 2024
Enhancing Your Automated Trading System: Key Insights from Best Pro Trade
November 14, 2024
NinjaTrader New Ecosystem Tools: October 2024 Edition
Enter Email for Updates