A comprehensive indicator suite for order flow and volume analysis. MarketProfile charts show the bigger picture, BookFlow visually displays the real time and historical order book and Footprint charts reveal the aggressive side of the market. Trade room access and a 14-day free trial are included.
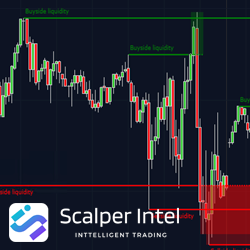
Unlock your trading strategy's potential with the Buyside & Sellside Liquidity Indicator. Gain deep insights into liquidity dynamics in ICT Trading methodology. Key features include Buyside and Sellside liquidity levels, revealing support and resistance zones, and Liquidity Voids.
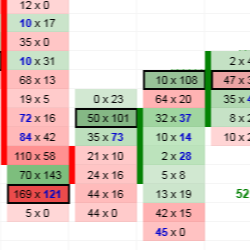
TD Order Flow features Heavy Volume Zones, multiple Volume Nodes, Imbalances, Unfinished Business, a built-in Trades Filter and a separate Cumulative Delta indicator as a bonus. It works with both futures and forex and includes 12 hours of Order Flow video training.
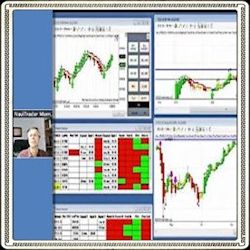
Would you like to improve your trading? Learn how to analyze the live market & the key factors that are critical for success! Open M-F, 9 – 11 AM ET, the Member Room provides the knowledge & demonstrates the tools needed to trade the ES, NQ, CL & more. Get started NOW with FREE live market training!
Trade with me every day and track the biggest financial institutions with Volume Profile. Receive the strongest volume-based trading levels twice a day, daily video commentary every day, the strongest swing trading levels, swing trading videos, access to members forum, video course & much more.
Become a pro trader with our 26 chapter Price Action Trading Course. Step by step guides showing you how to find signals, set up your chart,find trends,when & when not to trade & much more. Includes lifetime membership,live daily analysis,chatroom & weekly analysis video sent directly to your inbox.
Earl's ultra-configurable HAMA indicator not only smooths out price data, but it excels at helping you spot divergences and leading momentum swings with an "RSI Filter" setting. Trade with more confidence and less hesitation with the included Trend Trigger indicator to help time your entries.
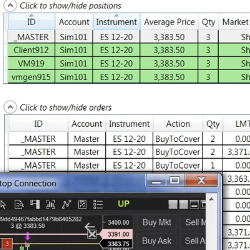
Replicate orders and manage positions from a master NinjaTrader instance to one or multiple NinjaTrader slaves.
Want to scan for any candlestick pattern, on any timeframe, across any list of symbols? Whether you're interested in the most common or advanced patterns, the Candlestick X-Ray™ detects over 90 unique candlestick patterns, making it a highly flexible and powerful candlestick pattern tool.
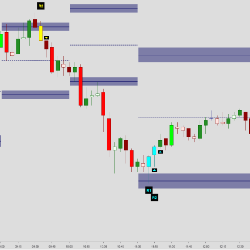
The Auction Bars indicator identifies higher time-frame ranges, displayed as Auction Ranges. These ranges show the current market value area of the ongoing auction. The accompanying congestion zones work as support / resistance where spike and reversal patterns frequently plot.
December 2, 2024
Mastering Sideways Markets With Auction Bars and Range Projections
November 19, 2024
Enhancing Your Automated Trading System: Key Insights from Best Pro Trade
November 14, 2024
NinjaTrader New Ecosystem Tools: October 2024 Edition
Enter Email for Updates