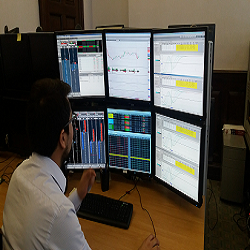
Learn to day trade equity Micro/E-Mini Futures for 1 to 3 hours per day 3 to 5 days per week. Day trading need not be complicated using our most advanced NinjaTrader trading system for day traders, a semi or fully-automated trade entry and trade management system.
This algo-based buy sell NQ strategy customized number of traders per day.
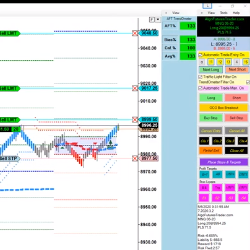
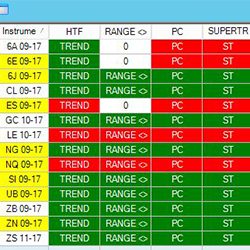
The JATS Market Analyzer Template for the NinjaTrader 8 platform has customized blackbox BloodHound solvers that show when momentum, linear regression and trend are in synchronization across multiple time frames.
The SDP History offers multiple ways for the user to visualize the aggressive auction from session to session and monitor for continuation (Leroys) and turning points (Elbows).
Free daily newsletter - global news & views; free weekly YouTube (Sunday) to prepare you for the week ahead; 1-day workshops; 1-week courses zero to hero; accredited masterclass financial & commodity trading; flexi-masterclass, which includes a free trading challenge; and trader mentoring.
Our Partner Programmer service is ideal for traders with great ideas and a limited budget. We help code your ideas and instead of paying for the programming service, we enter a joint investment agreement.
Get precious info to start your trading week! Focused 100% in E-mini S&P500 Futures and based in a mix of technical analysis with order flow tools, the newsletter presents possible trading scenarios for the week, highlighting important regions. Sign up now for FREE!
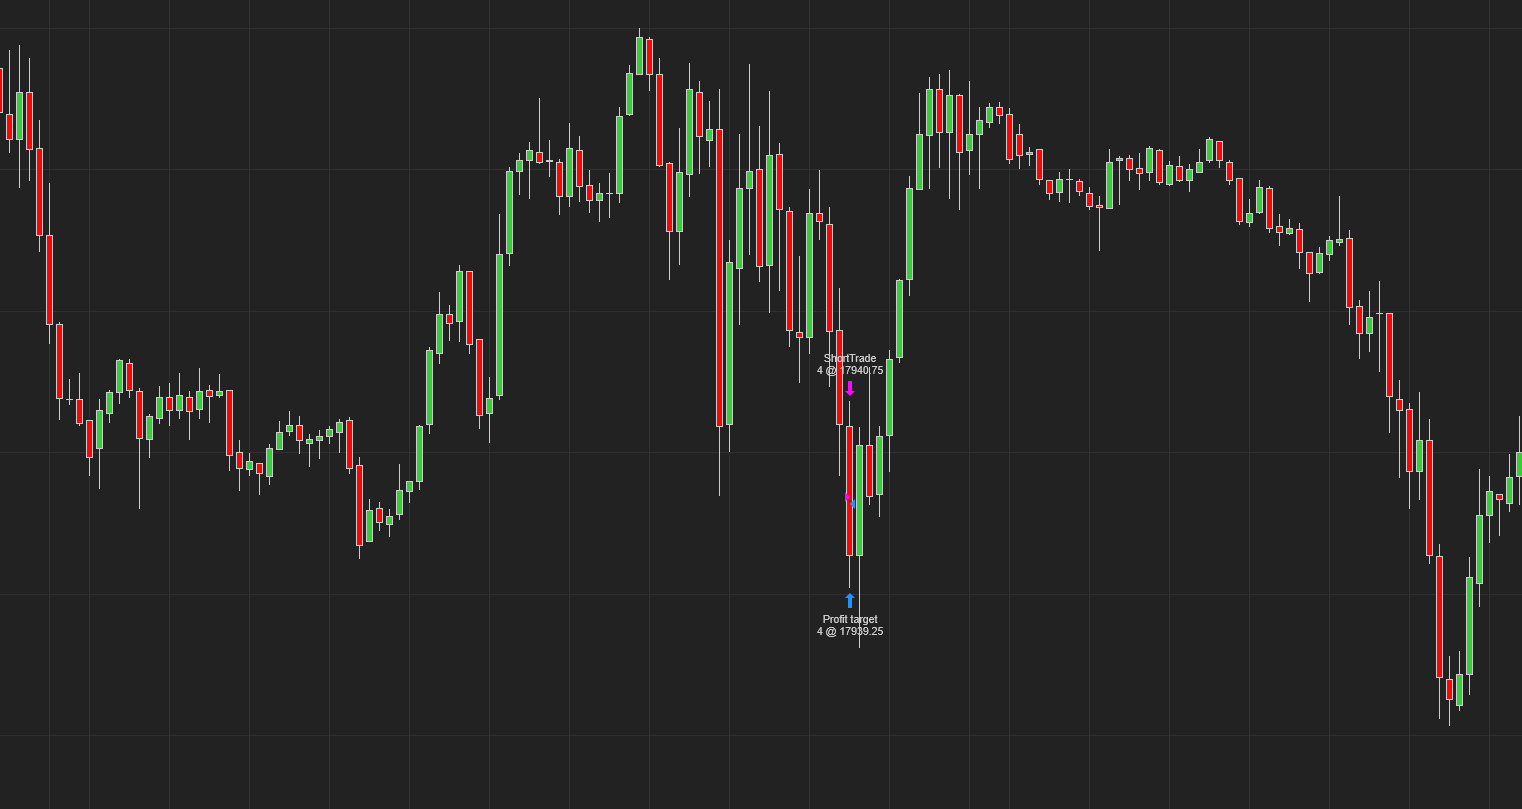
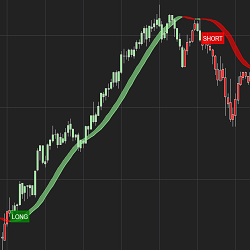
The HolyGrail Algo uses calculations of the Hull Exponential Moving Average to identify market direction. A long or short condition is printed on the chart and the strategy executes the trade by going long or short. You can set defined take profit, stop loss and trail and time of day to trade.
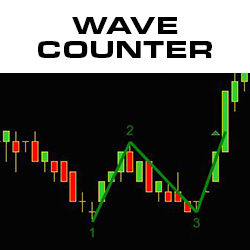
The Wave Counter indicator counts and paints waves in real time, revealing market trends, potential price reversals and no trade zones. The indicator emphasizes wave 3 as the main, informative wave, and creates a "chop box" when there are dueling waves. Download the Wave Counter today.
Trade your own capital with consistency. Follow your own plan from day one. Develop and demonstrate your trading skills. Pass qualification to get a Master Account. Show results and get your first $10k withdrawal commission-free. Invest in yourself. It's time to catch a wave!
December 2, 2024
Mastering Sideways Markets With Auction Bars and Range Projections
November 19, 2024
Enhancing Your Automated Trading System: Key Insights from Best Pro Trade
November 14, 2024
NinjaTrader New Ecosystem Tools: October 2024 Edition
Enter Email for Updates