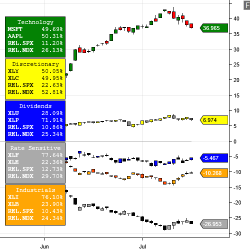
SectorJunky builds MarketCap Weighted Indexes from stock symbols with no math required. All indexes are perfectly weighted. You can also build Custom Weighted Indexes.
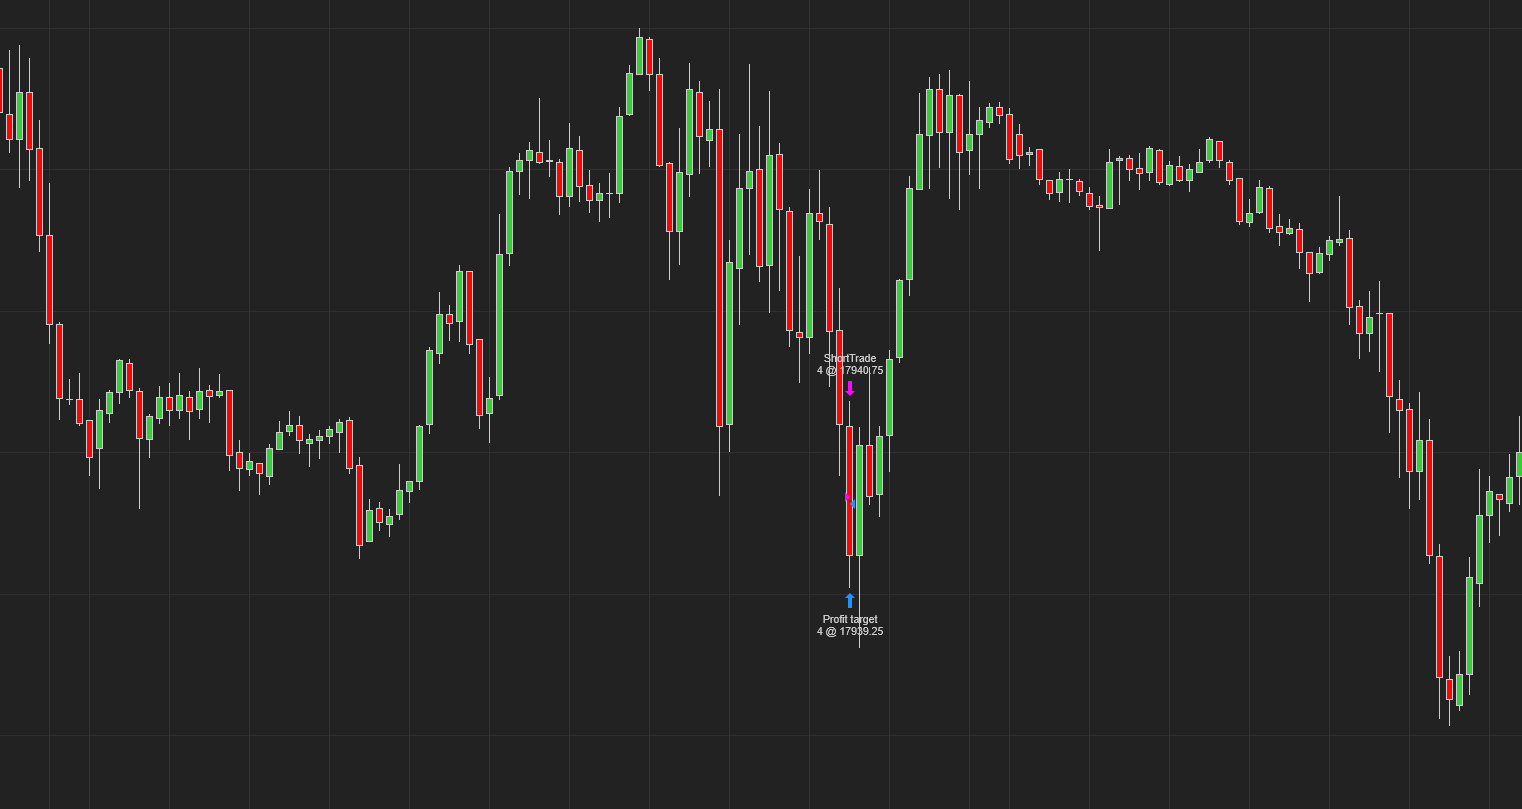
This algo-based buy sell NQ strategy customized number of traders per day.
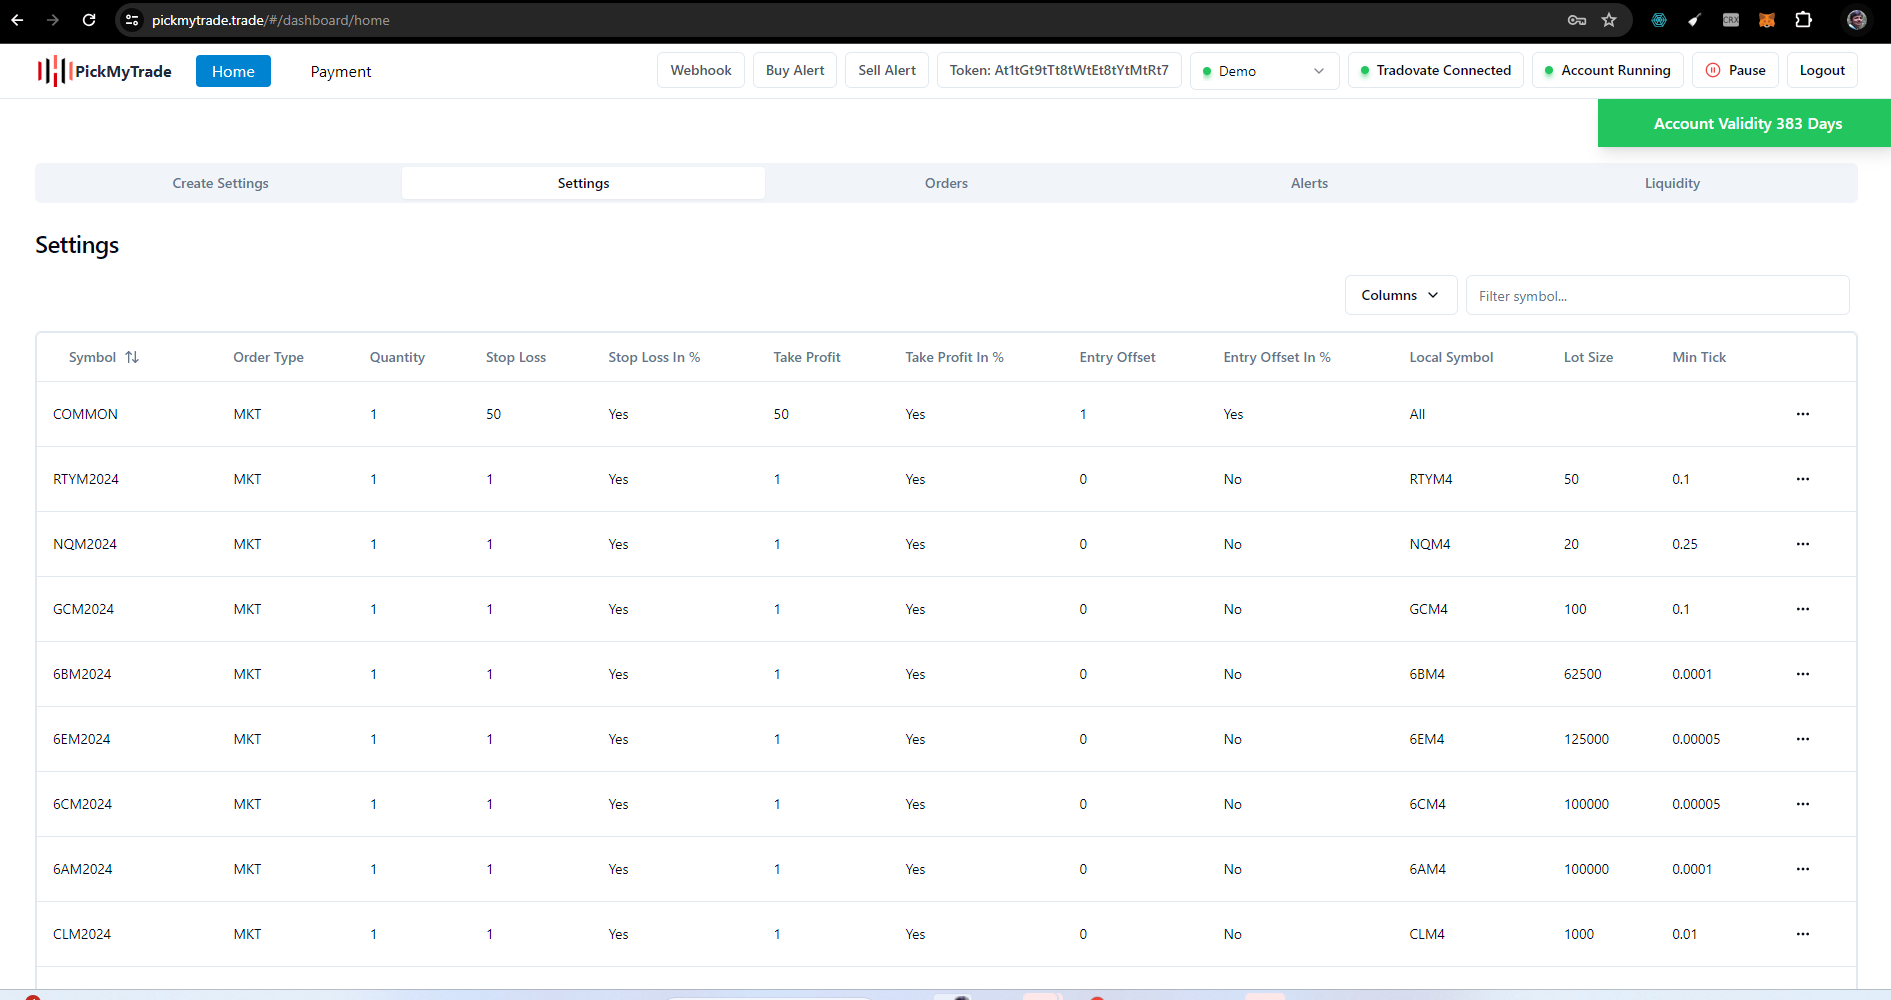
PickMyTrade specializes in automating trading bots, enabling seamless strategy execution for futures across well-known brokers such as Tradovate.
The VWAP Predator uses VWAP as a zonal guide with Bull and Bear Bands. It then uses logic to recognize accumulation and distribution candles. If those candles cross from a zone to another, then a Signal Candle is produced. Buy Signals in the Bullish Bands and Sell Signals only in the Bearish Bands.
Wizdough offers custom programming including custom indicators, strategies, backtesting and alerting. Contact us to get a free consultation.
This free package includes Symbol Watermark, which shows the name of the symbol and time frame directly on the chart; Trader Limit, which limits trading when the daily loss level is reached; SR Dynamic Lines (dynamic resistance zones); and many other useful tools. These products are free for life.
The LogikDynamicRange is a unique Range Bar with Dynamic Resizing capabilities. This is done by employing a non-lag range determination technique, continuously adapting the bar size throughout the day, capturing trends while displaying consolidation areas very easily.
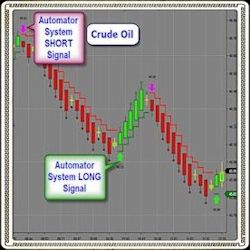
Automate your trade setups in real time with The Trade Automator! Backed by powerful built-in algorithms, the Trade Automator can help you become a more consistent trader, improve the timing of your entries & minimize emotional trading. Come see for yourself!
This tool and indicator helps you spot trigger entries with such features as one 4-range and one 14-range data series chart and one indicator. It's a simple, clean and very effective price-retrace system. Follow EdsRetracePlan to learn exactly when and where to buy or sell on price retraces.
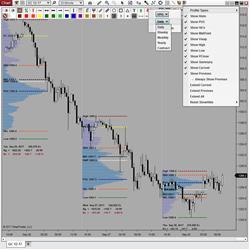
Volume Profile Sessions features 5 Profile Durations (Daily, Weekly, Monthly, Yearly, Contract) and 3 Modes of Calculation (bar/min/tick). It displays 8 Levels of Significance (VPOC, VA's, VWAP, High/Low/Mid, PClose) & session summaries, and provides simple configuration thru a toolbar icon!
December 2, 2024
Mastering Sideways Markets With Auction Bars and Range Projections
November 19, 2024
Enhancing Your Automated Trading System: Key Insights from Best Pro Trade
November 14, 2024
NinjaTrader New Ecosystem Tools: October 2024 Edition
Enter Email for Updates