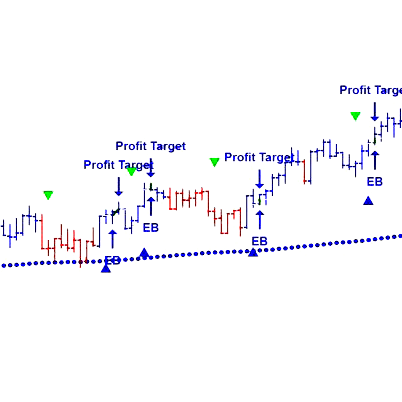
This fully-automated reactionary price and volume intraday trading strategy takes advantage of fluctuations of price, direction and momentum to currently trade the E-mini indices. We will be expanding into other futures, commodities and chart intervals in the near future.
TradeDevils Indicators offers unique indicators for NinjaTrader 8. Regardless of whether you are a scalper, a trend follower or a breakout trader, they can provide you with the right indicators to assist with your trading.
Weekly one-on-one coaching tailors trader development to the individual. Evening Chartbook & Market Recap, Daily Briefing and Sunday Evening Review reinforce technical and fundamental development and guide the practical application of tools, methods and strategy maturing into Best Practices.
Q-GZone provides visual gap zones between the bars. Gaps occur when a significant imbalance exists between buy and sell orders. It can lead to a gap in the price as the market seeks to match these orders. The market tends to return to and fill in these gaps.
This is an introductory class that is perfect for beginners. It covers a multitude of topics including Technical Analysis and trading with custom indicators. Learn through one-on-one and group live zoom classes daily.
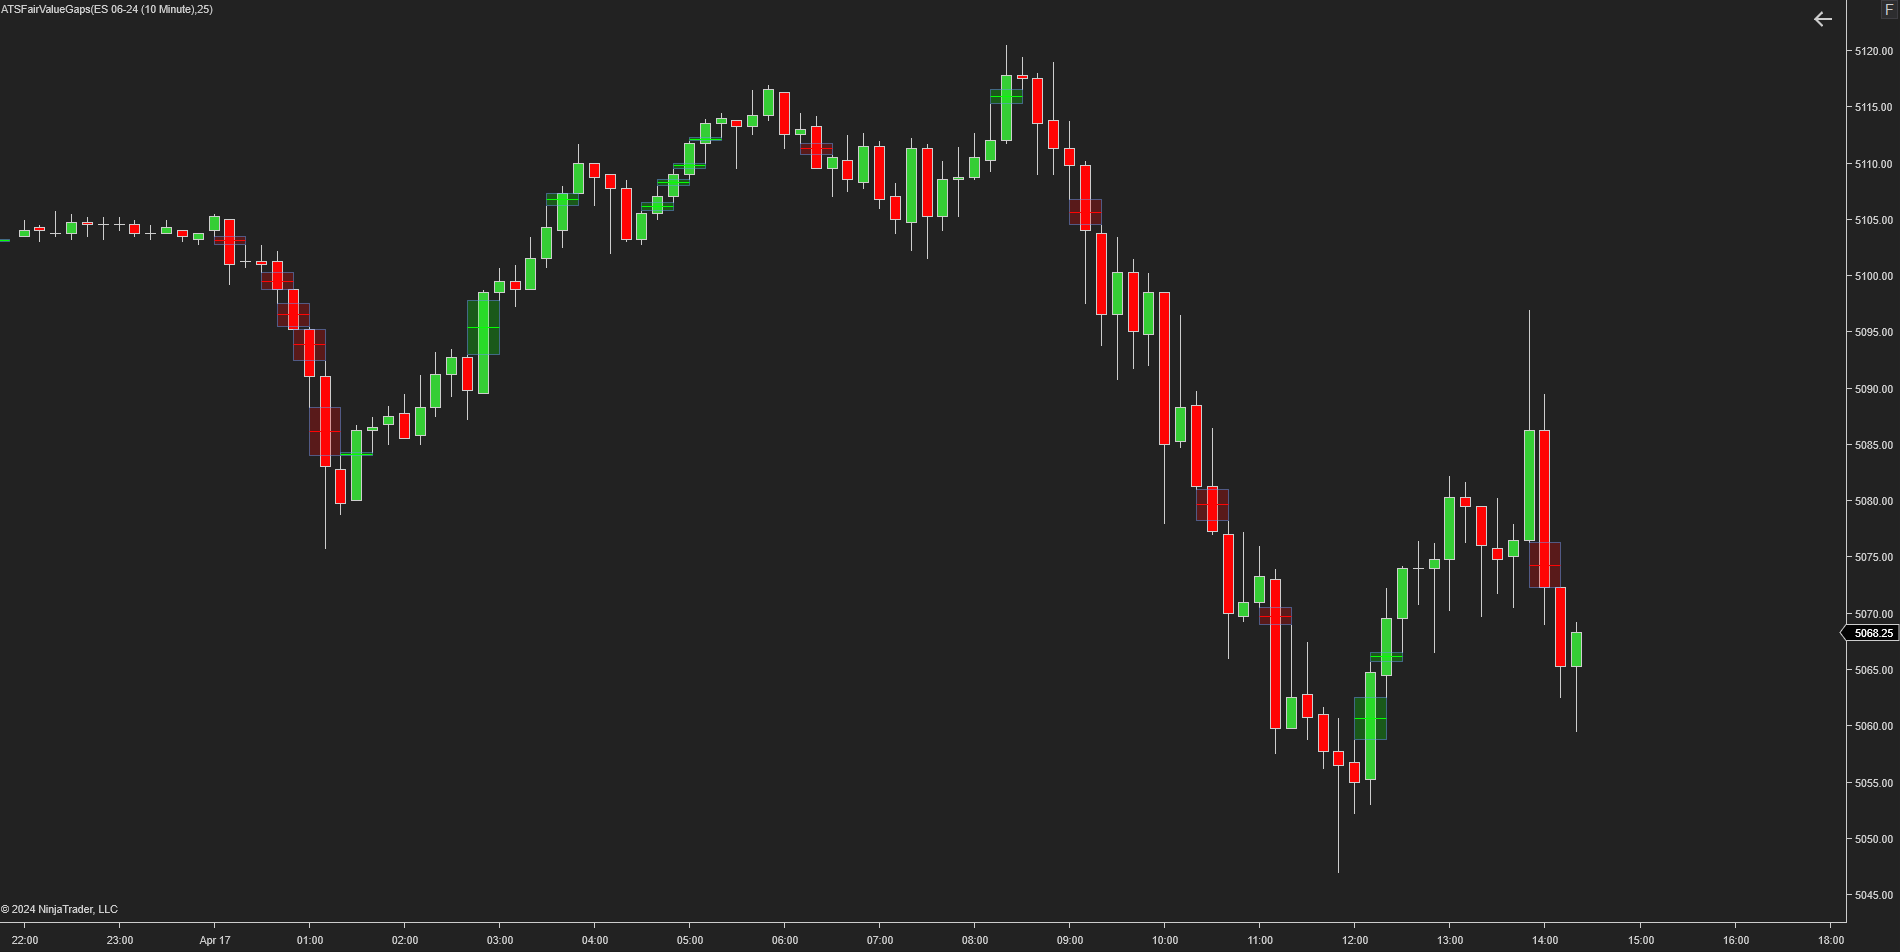
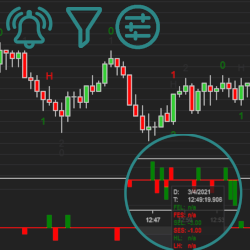
This indicator will plot the imbalances in the market. These imbalances are commonly known as Fair Value Gaps.
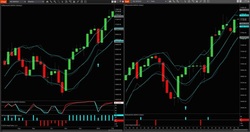
IATrend gives a clear indication of the trend of any financial instrument and does so on all different time frames.
Alerts on two-legged pullback status. Fourteen price action signals: second entries, higher low, lower high, failed 2E, etc. Five filters and preferences: reset on double top, engulfing bars, risk limit, etc. Precise counting of second entry, Mack’s technique. Flexible setup. Start a free trial now.
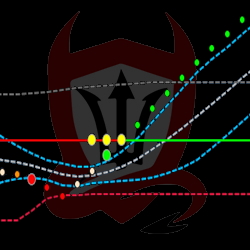
Neural Director advises trade direction and when to enter with the Golden Signal indicator. This toolset includes a predesigned workspace, accurate daily Power Fibs for many futures and forex markets, automatic Fibonacci extensions and automatic ATM entry.
No subchart indicators or additional time frame charts are required to see when price becomes overbought or oversold. This helps the trader identify weakness in an uptrend or strength in a downtrend to anticipate a potential change in price direction. An award winning "heads-up display" indicator!
December 2, 2024
Mastering Sideways Markets With Auction Bars and Range Projections
November 19, 2024
Enhancing Your Automated Trading System: Key Insights from Best Pro Trade
November 14, 2024
NinjaTrader New Ecosystem Tools: October 2024 Edition
Enter Email for Updates