Daily Levels plots important levels such as prior days open/high/low/mid/close, overnight high/low/mid, IB high/low and more! It also displays historical probabilities of price touching each level in regular and overnight sessions for the most popular futures products.
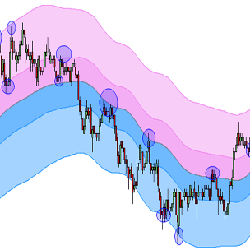
A remarkable price channel, with a proprietary formula that is adaptive to market conditions and reveals dynamic support and resistance levels. TC_NovelChannel paints two colored bands which show a consistent tendency to provide support and resistance to price, for any instrument or time-frame.
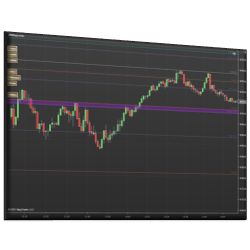
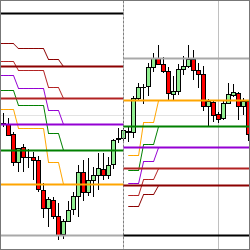
The Key Levels Confluence Indicator calculates various daily levels and combines them into powerful zones where price action is likely to respond in the future. Daily levels include the Open, High, Low and Close (OHLC) of past days, Fibonacci Levels, Whole Numbers, Current Day Levels and Pivots.
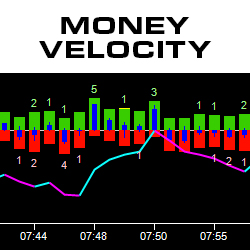
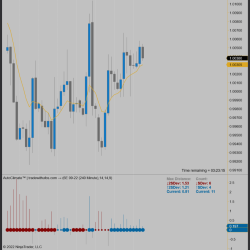
The Money Velocity indicator visually presents Time and Sales data. Easily see real-time bars featuring the number of sales at & above the ask price plus the number of sales at & below the bid price. Additionally, the indicator displays the difference, order flow trend and block trades. Learn More!
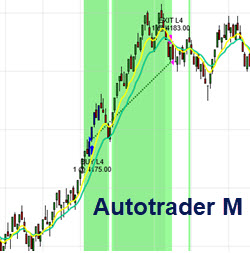
The AuToTrader M is an automated system for highly active traders willing to conservatively trade high-volatility future instrument (CL, ES, YM, etc.)The system comes w/ BACKGROUND M to track positions, a powerful money management module to protect profit & principal.Lease includes training, support
Did you realize that 95% of retail traders FAIL? The short answer to unlocking failure is learning how to manage emotions while trading. It's learning how to control that voice inside of you that causes you to chase trades, enter too early, revenge trade, FOMO, over trade, blow accounts, etc.
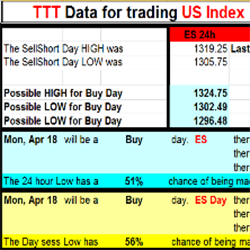
Based on the trading techniques of George Taylor, the TTT E-Book provides the necessary data to trade using the Taylor Trading Technique. After the market close receive 24 hour and daily data to plan your trades for the next trading session. Free 1-week trial available!
The Lucrum Fibonacci Retracement/Extension indicator is a tool that calculates the respective Fibonacci retracement levels based on the peaks and valleys of a range bound deviation indicator. Identify key price points to project future and past support and resistance levels.
Would you like to access planning charts from the top retail traders in the industry which could help you become a more consistent trader regardless of whether the market is trading up, down or sideways?
Intelligent technology assesses the market environment from a statistical point of view in order to answer the key questions before a trade: “Which side of the market should I be in?”, “Should I be a buyer or a seller?”, or “Should I simply avoid trading and not trade at all?”
December 2, 2024
Mastering Sideways Markets With Auction Bars and Range Projections
November 19, 2024
Enhancing Your Automated Trading System: Key Insights from Best Pro Trade
November 14, 2024
NinjaTrader New Ecosystem Tools: October 2024 Edition
Enter Email for Updates