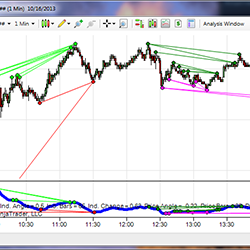
The Divergence Indicator for NinjaTrader utilizes a sophisticated algorithm to detect divergence, and eliminates some shortcomings of typical divergence indicators. It can be calculated using any indicator within NinjaTrader (ex. RSI, MACD, Stochastic, or any custom indicators).
Get your trade information at-a-glance. Adding the Status Box on your chart allows you to see your relevant trade stats instantly.
This system will take you through the process of how to "risk 1 to make 2" that professional traders utilize to increase their profitability and have consistent months, quarters and years. The system incorporates philosophies found in "Trading in the Zone" by Mark Douglas.
See trade setups develop in real time in the Easy E-mini Trade Chat Room! Open Monday – Thursday 9:15 – 12:00 ET, sign up for your 3-day trial today!
KaseX is a symbol based technical analysis trading study with a simple, uncluttered display. KaseX captures dozens of complex technical signals in multiple time-frames. Variable optimization is unnecessary as pre-configured sensitivity settings are built in. Take a free 30-day trial today!
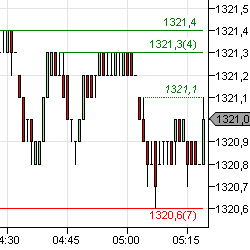
GomBang displays double/multi-top levels on the chart, with the unique ability to merge the levels from multiple charts and time-frames. For instance, if it’s displayed on 5 minute, 4 range and 800 tick charts, the 5 minute chart will display levels from all 3 charts.
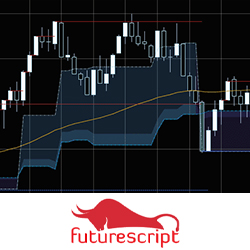
These two indicators together will display powerful momentum trading setups by defining the critical levels and pivots. The advantage of this with the market is recognized when repeatable scenarios and situations arise despite the fact that the market never shapes up exactly the same way twice.
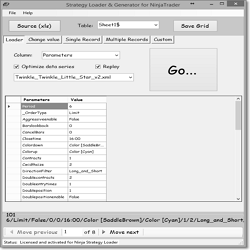
The Ninja Strategy Generator allows traders to make changes to the Parameters record that exports from NinjaTrader to create new strategies with slight variations of the strategy you wish to optimize.
Tradesight posts regular weekly market previews and trade recaps on their YouTube page. The service is free.
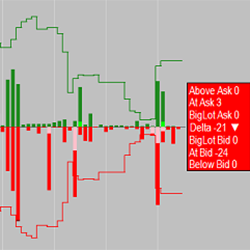
Use the Tape? Time & Sales can be hard to follow; however, this indicator boils it down to an easy to read histogram. Easily see the bid & ask trades, above ask & below bid trades, BigLot trades, the delta bid/ask ratio and much more. Learn more about the BigLotHistogram indicator now!
December 2, 2024
Mastering Sideways Markets With Auction Bars and Range Projections
November 19, 2024
Enhancing Your Automated Trading System: Key Insights from Best Pro Trade
November 14, 2024
NinjaTrader New Ecosystem Tools: October 2024 Edition
Enter Email for Updates