Fully automated E-mini trading systems. These auto traders are designed to operate continually and without any human intervention. All of our systems have gone through extensive testing to ensure that hypothetical backtests are as closely representative of a live trading environment as possible.
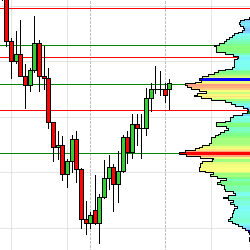
GomMPPro is a high-performance tick-based volume profiler. It offers many data points such as: HVN/LVN, POC, VWAP & VA. Additionally, it features customizable hotkeys allowing traders to quickly toggle between favorite settings. Free 2-week trial available.
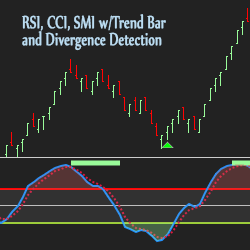
Use UppDnn.com’s Momentum Indicators to identify divergence and momentum changes as signals emerge at reversal areas. These upgraded indicators include Relative Strength Index (RSI) with Divergence Detection, Commodity Channel Index (CCI) and Stochastic Momentum Index (SMI) with a Trend Bar.
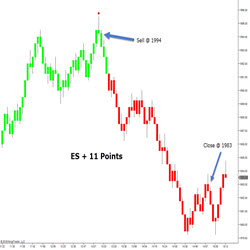
The ATS TrendReversal indicator predicts the end of a trend and reverse direction. The ATS Reversal combines multiple studies that measures distance, support, resistance and strength to pinpoint turning points in the market.
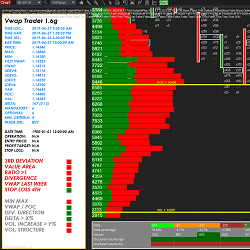
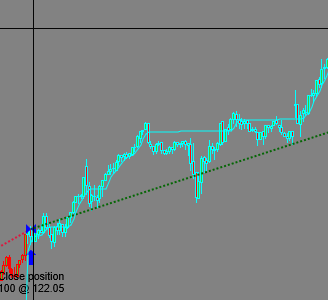
itcVwapTrader is a strategy for NinjaTrader 8 which is based on the mean reversion and the use of orderflow (vwap, footprint, market profile) for precise entries. This strategy uses more than 14 criteria for decision making. The strategy is highly customizable and comes in 3 versions.
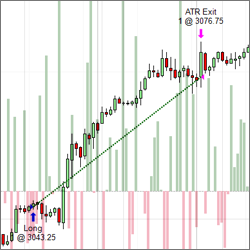
A trend following tool that can achieve exceptionally high risk/reward ratios when applied to suitable markets that trend well. Locks onto trends and does not let go until the trend ends. Not entirely suitable for novices. Strategy, paint bar and indicator included. Automated or manual operation.
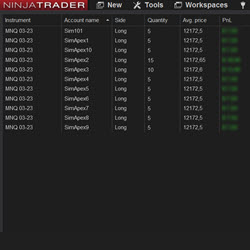
With this tool you can copy your own trades to multiple accounts from the same broker. If you use Propfirms with multiple accounts this is a must have for you. You can trade up to 20 accounts, open orders between different instruments, and have the possibility for an order multiplier.
Automated trade & risk management for Futures, Forex & Equities markets. Pre-program order movement & enhance position scaling. Automate entries, profit targets & stop-losses. Lock in profits with high-water mark protection & preview trades based on current market conditions. Upgrade your ATM now!
Moore Tech, LLC has over 15 years of experience working with TradeStation, and have converted hundreds of indicators and strategies to be compatible with NinjaTrader. Contact them today to receive a free estimate for having your code converted from EasyLanguage to NinjaScript.
Hands Free Trader has been providing experienced and honest NinjaScript Programming solutions since 2009. Through consulting, backtesting and educational services, the goal of Hands Free Trader is to develop indicators and strategies that remove human error.
December 2, 2024
Mastering Sideways Markets With Auction Bars and Range Projections
November 19, 2024
Enhancing Your Automated Trading System: Key Insights from Best Pro Trade
November 14, 2024
NinjaTrader New Ecosystem Tools: October 2024 Edition
Enter Email for Updates