The Sigmalab team is specialized in financial software design and development. They offer custom trading system and indicator programming services and market analysis tools for the NinjaTrader platform.
OTM Volume Profile is essential to understand the auction behavior and find key price reaction zones, such as the VPO, high and low value area. This profile preserves and allows to visualize these levels historically, which distinguishes it from static profiles.
This is the "heads-up display" indicator that has made The Intentional Trader famous since 2009. It will tell you when the “Smart Money” market makers are likely to be manipulating price. If you know that, then you can evaluate what may happen next - a huge edge in day trading!
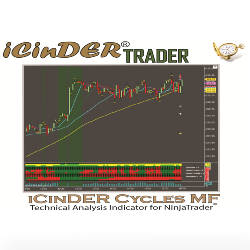
The iCinDER™ MF (Market Forces) includes all of the iCinDER™ family of indicators as part of a complete set. The analysis is based on internal market force of the instrument being analyzed. Learn more!
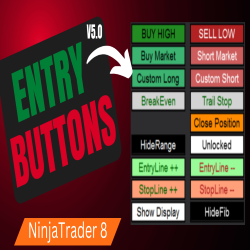
Automatically calculate your position size, stop and profit target. These buttons set your entry at the High/Low of the candles selected. You can also use our buttons to enter a Market Order and even customize your own set of order entry buttons. Set a breakeven (2 options) or set a trail stop.
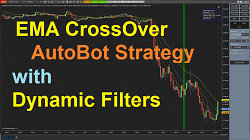
The EMA CrossOver Strategy is one of the simplest, for ease of use and understanding. This simple strategy has been enhanced with a third EMA as a filter for taking a long or a short entry. This EMA filter helps reduce unwanted entries.
This fully-automated trading strategy from Indicatortrader works on both NinjaTrader 7 & 8. It can operate 24 hours a day can be implemented in equity, futures and forex markets. Use this strategy to backtest years of historical data to find the best possible trading hours.
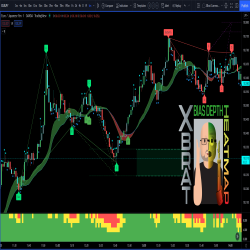
This trading indicator is the ultimate “go/no-go gauge” for any trading strategy. A sub-chart that looks up six timeframes and gives real-time BIAS. Bullish, neutral or bearish on each level. Making decisions and acting on trading signals made easier!
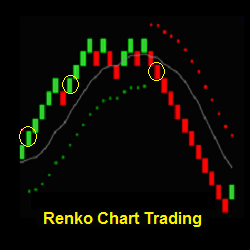
Renko Chart Trading offers day trading strategies, indicators and a training program focused on Renko charts. Learn the characteristics of how Renko charts can emphasize price, help filter chart noise and add clarity to trading. Join the Renko Trading Group today!
By marking the high and low range from 8-9 AM and extending these levels along with the midpoint throughout the session, this indicator provides insights into market dynamics right after the open. Traders can use this information to strategize around the rejection or acceptance of these levels.
December 2, 2024
Mastering Sideways Markets With Auction Bars and Range Projections
November 19, 2024
Enhancing Your Automated Trading System: Key Insights from Best Pro Trade
November 14, 2024
NinjaTrader New Ecosystem Tools: October 2024 Edition
Enter Email for Updates