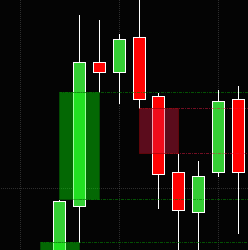
ICT's Fair Value Gap indicator retains a configurable number of gaps, and there's a setting to remove those that have been crossed by price. The style of the rectangle and the rays from the gaps are customizable by creating a template for a rectangle named "FVG Up Gap" (for the Up gaps).
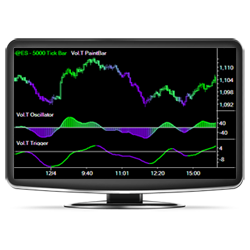
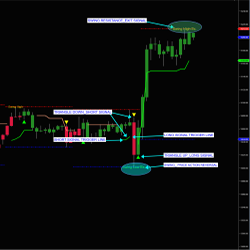
The Vol.T™ indicator package diagnoses volume-trend and tick-pressure to provide trading signals based on buying or selling pressure (rather than just movements in price). Come see how the Vol.T™ Indicators utilize volume and tick data more effectively than ever before!
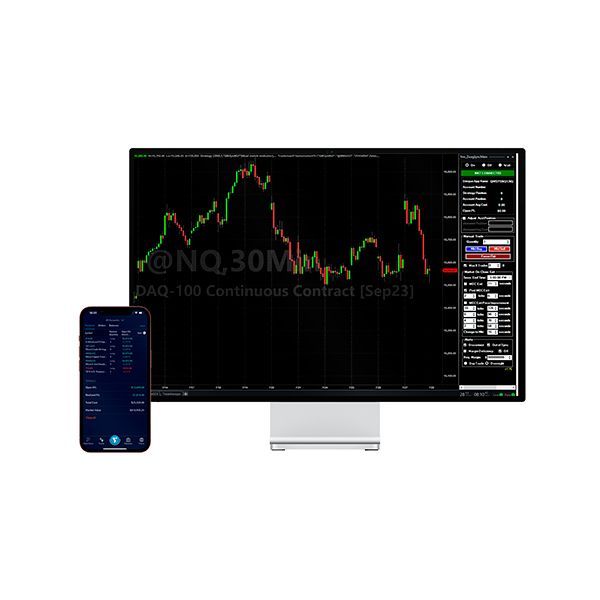
With these trader support plans you will have everything you need to carry out your operations in a professional way. They put at your disposal the latest technology on algorithmic trading. Proven software used by professional traders.
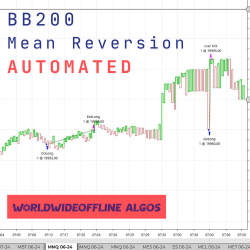
The original BB200 mean reversion strategy is designed for NQ/MNQ, on their specific Kagi set charts. BB200 can be deployed on any pair of your choice, not just NQ/MNQ. Backtesting is suggested before use. They like to run the strategy on ES/MES, as well. BB200 utilizes a trend filter.
Easily build order flow strategies using bar point of control and value areas highs and lows. No complex coding required. Optimal Value Area is fully compatible with Strategy Builder.
The code you need to automate your trading. No more disappointing programmer deliverables or painstaking hours of DIY programming. We specialize in writing strategy code that removes the technical barrier to successful automated trading.
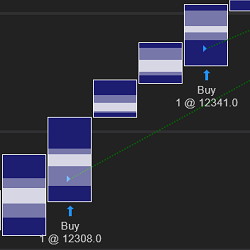
MagnaST122 and PAR Swing Indicator. Long: When price touches the moving average trigger line, a triangle up long signal triggers. Short: When price touches the moving average trigger line, a triangle down short signals. Swing low and swing high signal potential exit and/or price action reversal.
Unlock the power of fully automated NQ and MNQ futures trading with Steady Turtle. This advanced trend-following strategy adapts to market momentum and volatility, offering precise, emotion-free execution with robust risk management.
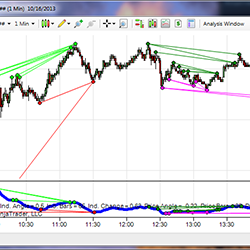
The Divergence Indicator for NinjaTrader utilizes a sophisticated algorithm to detect divergence, and eliminates some shortcomings of typical divergence indicators. It can be calculated using any indicator within NinjaTrader (ex. RSI, MACD, Stochastic, or any custom indicators).
Weekly one-on-one coaching tailors trader development to the individual. Evening Chartbook & Market Recap, Daily Briefing and Sunday Evening Review reinforce technical and fundamental development and guide the practical application of tools, methods and strategy maturing into Best Practices.
December 2, 2024
Mastering Sideways Markets With Auction Bars and Range Projections
November 19, 2024
Enhancing Your Automated Trading System: Key Insights from Best Pro Trade
November 14, 2024
NinjaTrader New Ecosystem Tools: October 2024 Edition
Enter Email for Updates