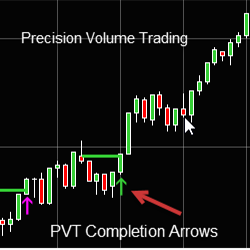
Precision Volume Trading Completions Arrows helps traders determine if the market will move up or down.
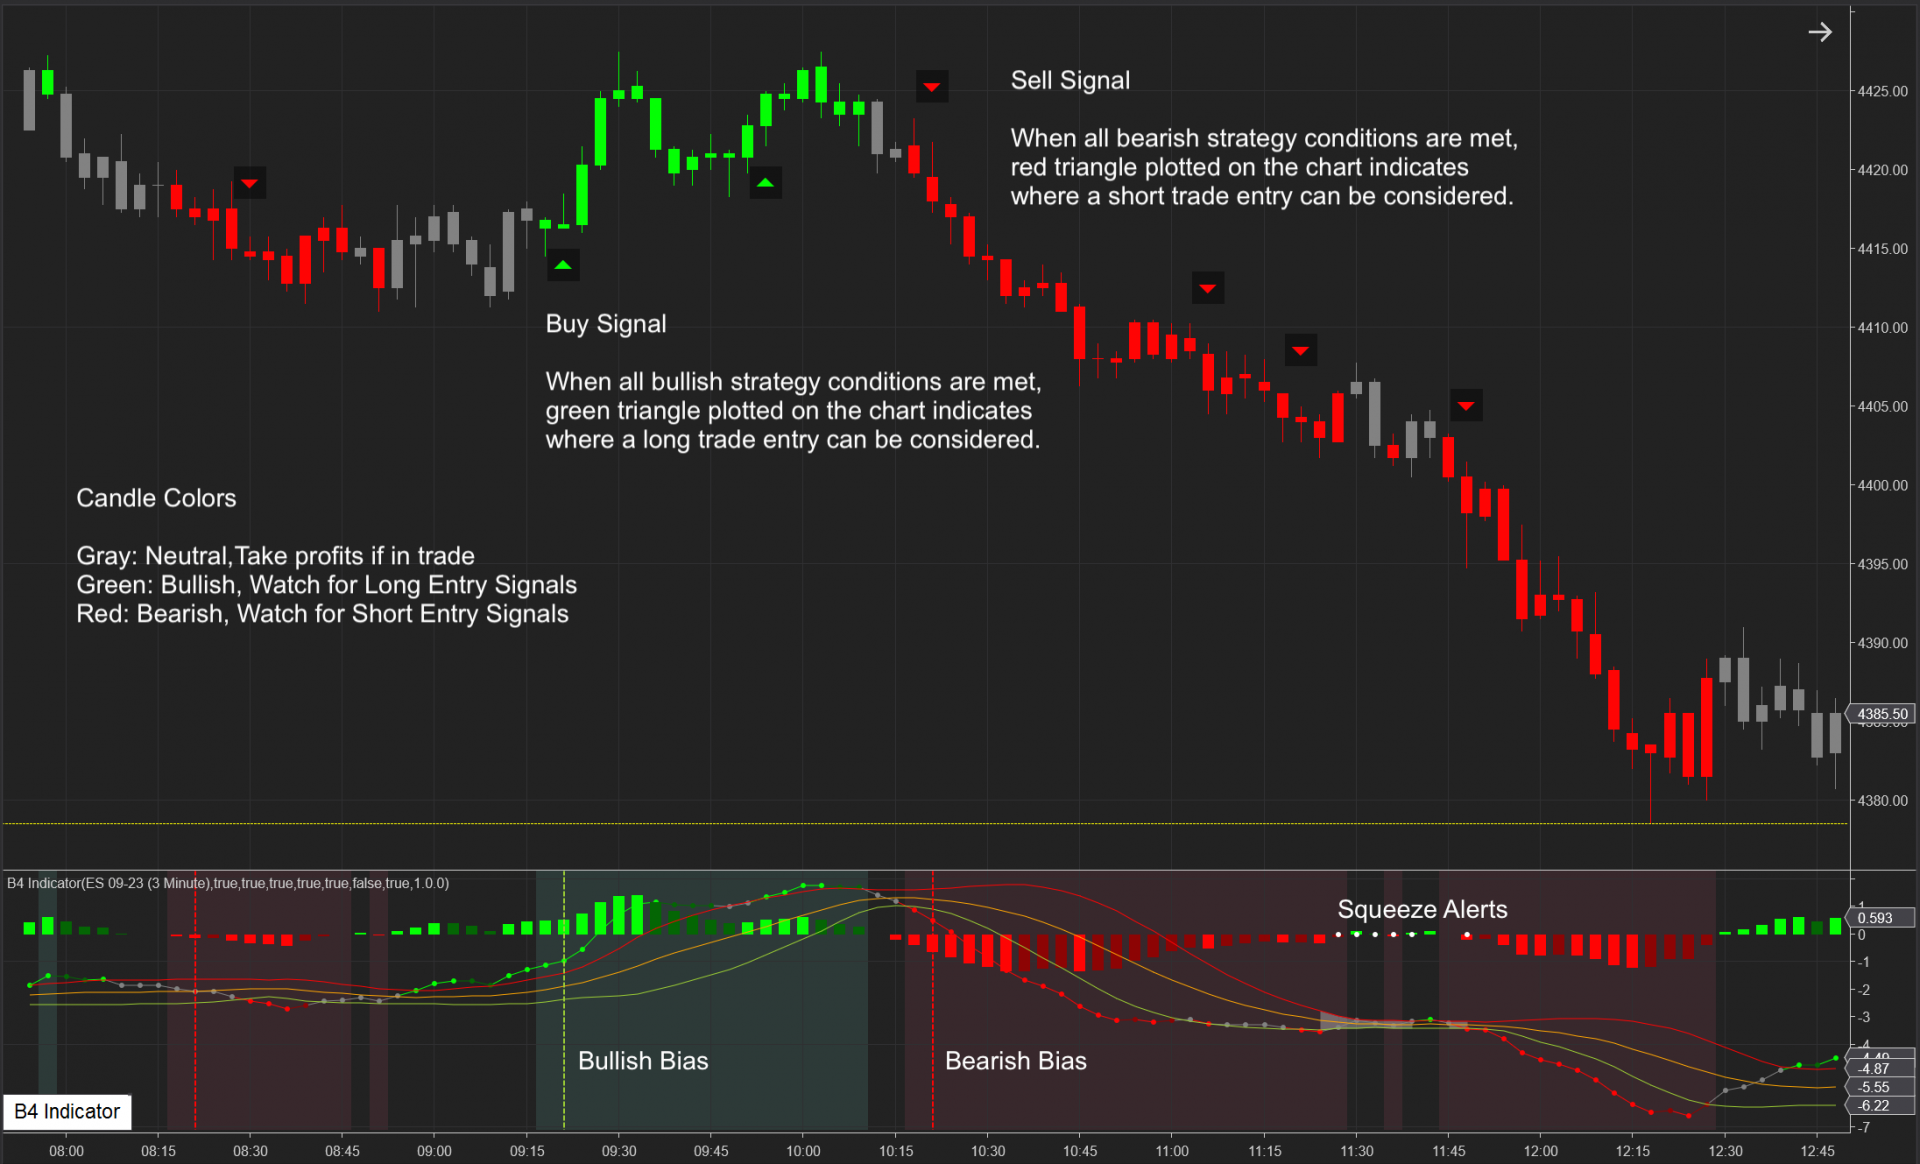
B4 Indicator is a trend and momentum indicator with buy and sell signals. Indicator background color shows the trend bias. Vertical lines show the trend confirmation. When all conditions are met, buy and sell signals are plotted on the chart. It also includes capabilities to detect market squeezes.
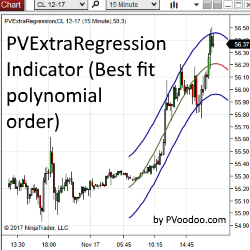
PVExtraRegression Indicator & Strategy is a regression channel taken to the next level, calculated using higher order polynomials. Use PVExtraRegression as a discretionary indicator or automated strategy!
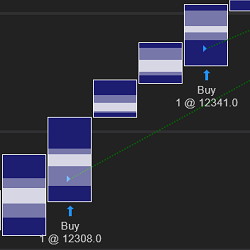
Easily build order flow strategies using bar point of control and value areas highs and lows. No complex coding required. Optimal Value Area is fully compatible with Strategy Builder.
QSR Pro utilizes their advanced techniques to identify, validate, and invalidate support and resistance levels like never before. Unlike other indicators that rely solely on swing highs and lows, QSR Pro incorporates multiple factors to ensure precise support and resistance identification.
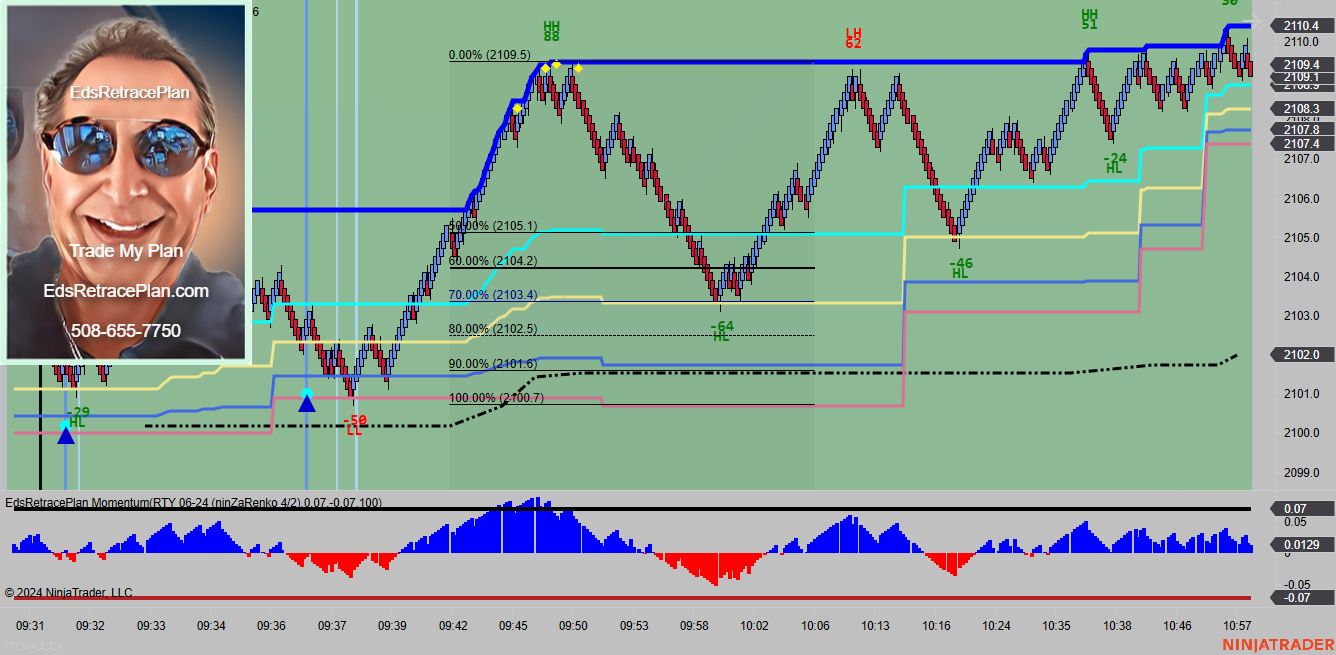
EdsRetracePlan Momentum Reversal Indicator is for day trading ES, YM, RTY, NQ, CL and GC. The indicator identifies reversal trades by finding and marking tops and bottoms. These trades signal the end of a move and opportunities to get short at the highs and long at the lows.
Do you wish to diversify your trading by following in the footsteps of successful traders? Do you wish to keep your forex broker and still follow successful traders? Would you like to do this at a very reasonable cost? If you answered "Yes" then this is for you.
Learn how to approach an active risk-based portfolio management trading multiple instruments at the same time. You will learn to design a diversified portfolio and equip yourself with the right tools, processes, and mental framework necessary to be successful at managing it. Get your blueprint now!
Track NYSE and NASDAQ market breadth divergence directly from your price chart - even on Renko bars! Optimal Breadth seamlessly integrates advance-decline internals with your price chart and plots three intraday divergence types: classic, hidden and micro. Never miss a signal again!
Quaderr offers 12 High Quality indicators totally FREE. Please click the link below to get yours!
December 2, 2024
Mastering Sideways Markets With Auction Bars and Range Projections
November 19, 2024
Enhancing Your Automated Trading System: Key Insights from Best Pro Trade
November 14, 2024
NinjaTrader New Ecosystem Tools: October 2024 Edition
Enter Email for Updates