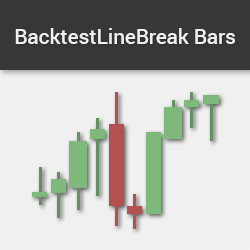
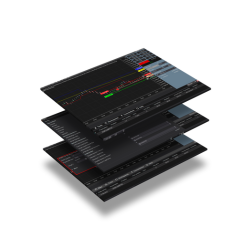
The Line Break Bar is one of the most effective ways to reduce chart noise. It provides accurate back-testing results by showing the correct open prices and restoring the wicks. Easily recognize divergence & price action patterns & eliminate noise from traditional minute charts. Get started today!
The Emet Trading Solutions team of experienced programmers specialize in converting existing indicators, strategies or code from cAlgo, MetaTrader, TradeStation & MultiCharts to NinjaTrader 7 or NinjaTrader 8. Get a free quote for your project today!
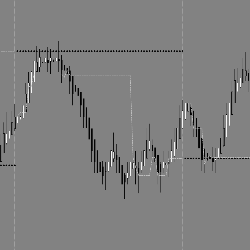
EPyFVPOC is an indicator which displays in real-time the most traded price of the current day, as well as for any previous days loaded in your chart. It also indicates the Point of Control for the previous session, an important level for intraday traders.
Ideal for those wanting to place pending orders with a single click, execute lightning-fast market orders, or simplify trading for users with slower computers or impaired eyesight. Key features include support for various order types, quantity presets, ATM selector, and real-time status display.
This trading masterclass delivers all the fundamental knowledge and trading skills as the foundations on which to develop your trading career for financial, commodity and digital asset classes. Up to one year to complete. Includes a free trading challenge to qualify for a funded trading account.
Do you have a trading concept? Let's get it coded right now! Schedule a free consultation today with Yuri, algorithmic trader and full stack developer. NinjaCoding provides solutions for strategies, indicators & extensions to visualizers, database server integrations and third party conversion.
Don't miss any more targets by a few ticks with Target Zone!
Market Analyzer 96 Trade Systems is a framework of 96 easy-to-use trade systems to test market conditions. With this course you will be able to extend the provided framework and use it as a powerful tool for building trade systems.
Streamline your trading with semi-automated tools that efficiently manage positions, whether long or short, across specific instruments in your account.
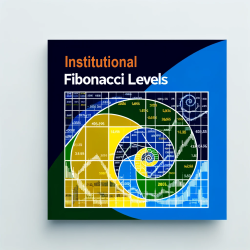
Fibonacci LevelsL Institutional Support and Resistance Levels by DTB Traders offer unparalleled accuracy for futures market trading. With automatic adjustments for new highs and lows, save hours on analysis across multiple instruments and time frames.
December 2, 2024
Mastering Sideways Markets With Auction Bars and Range Projections
November 19, 2024
Enhancing Your Automated Trading System: Key Insights from Best Pro Trade
November 14, 2024
NinjaTrader New Ecosystem Tools: October 2024 Edition
Enter Email for Updates