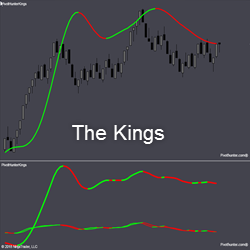
THE KINGS include King 1, 2, 3, and 3Kings. They measure order flow at 3 levels, then combine all three into one - The 3Kings. The bottom panel shows Kings 1, 2 & 3. The top panel shows them combined into The 3Kings. This provides traders with a very smooth indication of order flow.
Automated Trading Strategy for trading MNQ.
This course, in French, details the step-by-step path to profitability, from the basics of trading to order flow, and the best known indicators. This course is the result of months of work and years of experience. Satisfied or your money back for 14 days – try it out!
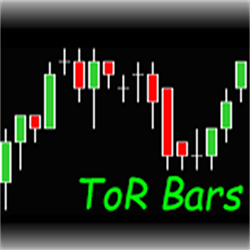
Time Or Range is a custom bar type with intervals at a predetermined elapsed time span OR price action range.
PFAHedger is an innovative addon to the PFAZoneSuite supply & demand indicator, providing the ability to submit hedging positions on any market. Simultaneously submit trades on any market while submitting hedge orders on another market, directly from the same chart.
Fully-automated. The VMX selects a time of day to trade during the cash session for stock index futures. This system takes advantage of the volatility created by big institutions moving asset allocations in the equity markets. All positions closed before the end of the cash session.
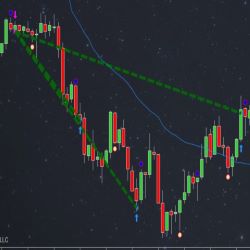
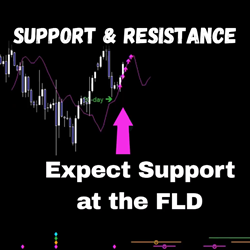
Perform an expert Hurst cycle analysis on any instrument/timeframe chart, and gain insight into hidden levels of support & resistance with accurate targets. Interactions between price & the Future Line of Demarcation (FLD) are identified for you, enabling anticipation of price action ahead of time.
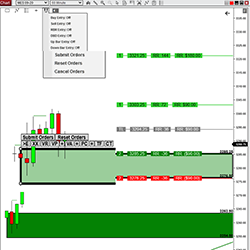
Click Trader is designed for quick and efficient chart trader order entry. Enter and manage trades with one click. No more working with the right-click menu. Sync multiple stops or targets to the same price in a single click. Works with ATM strategy stops and targets.
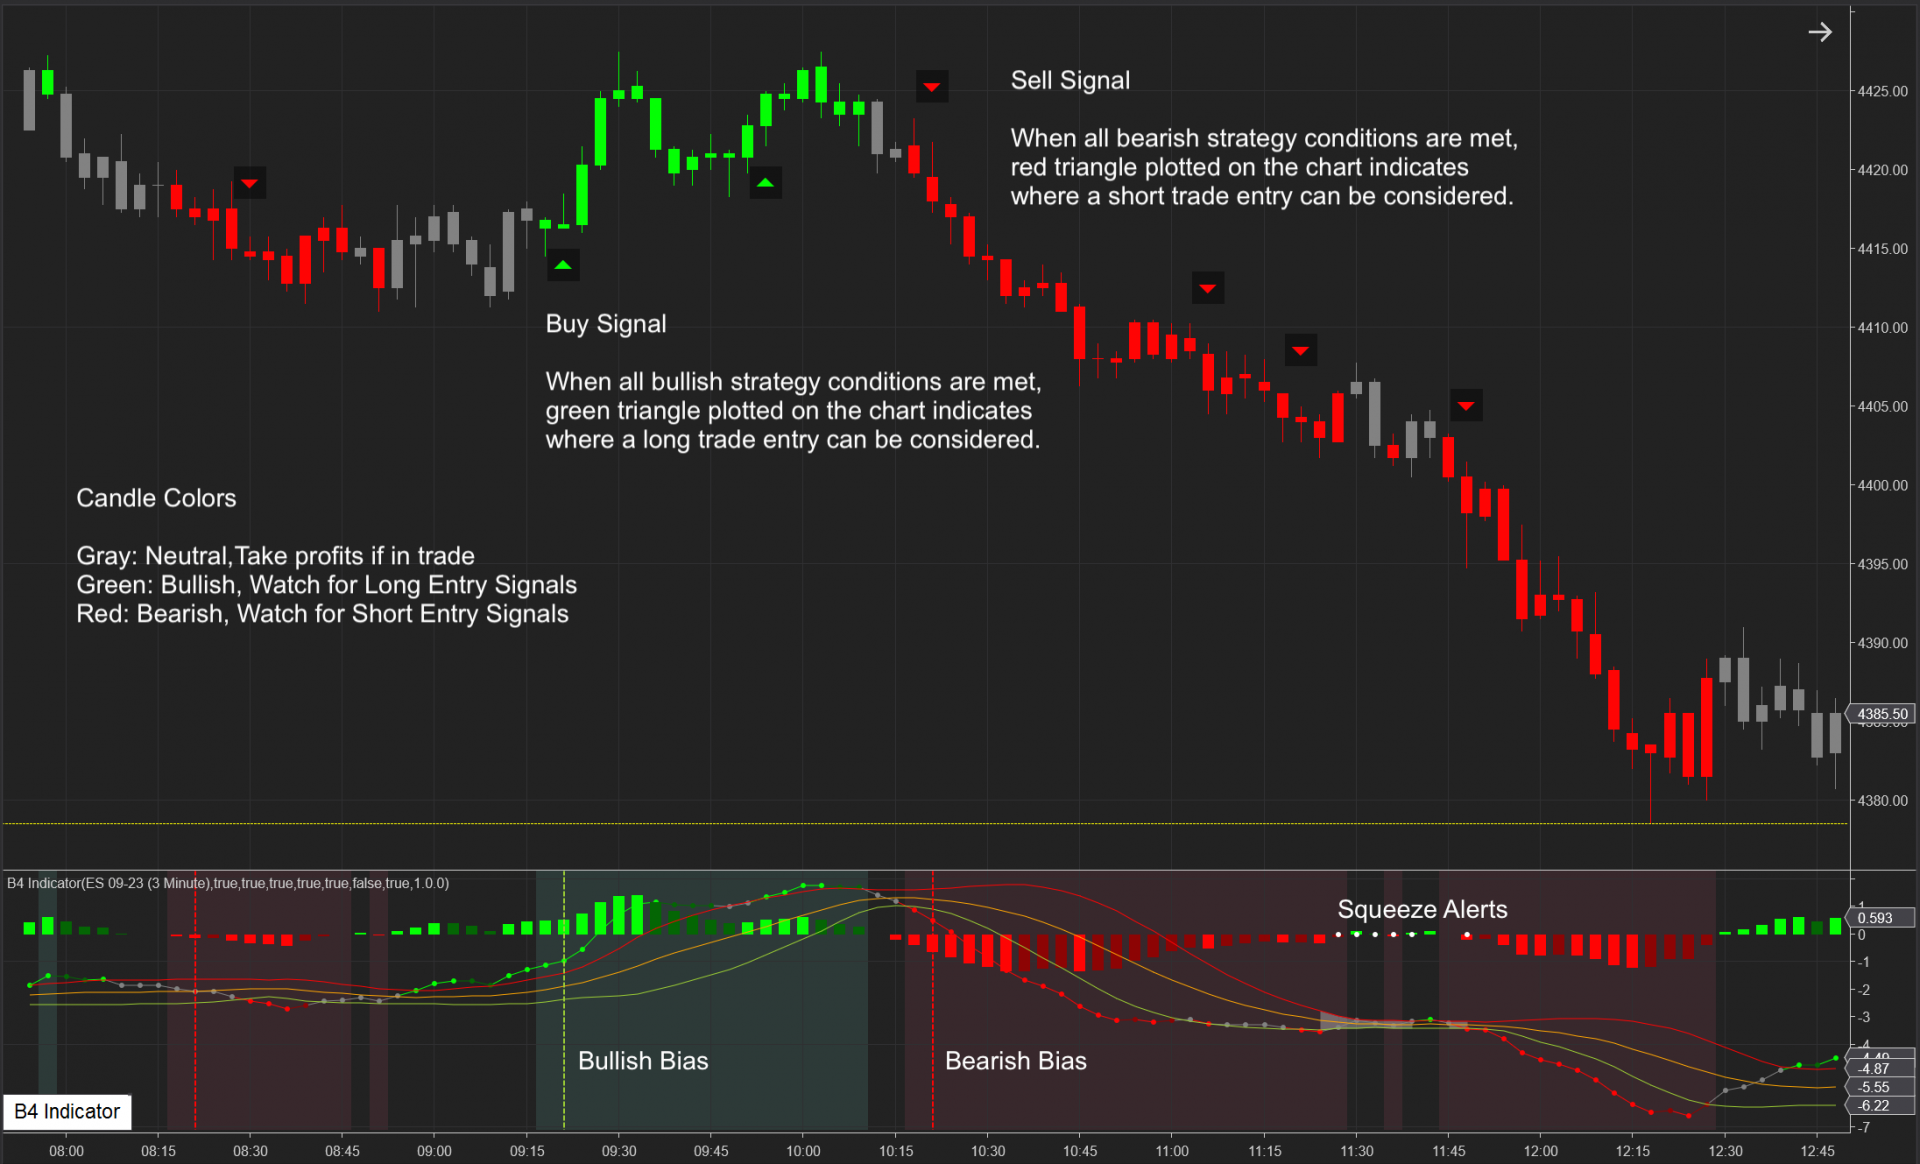
B4 Indicator is a trend and momentum indicator with buy and sell signals. Indicator background color shows the trend bias. Vertical lines show the trend confirmation. When all conditions are met, buy and sell signals are plotted on the chart. It also includes capabilities to detect market squeezes.
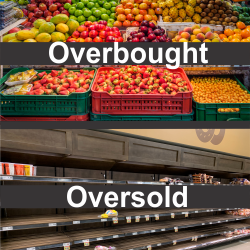
No subchart indicators or additional time frame charts are required to see when price becomes overbought or oversold. This helps the trader identify weakness in an uptrend or strength in a downtrend to anticipate a potential change in price direction. An award winning "heads-up display" indicator!
December 2, 2024
Mastering Sideways Markets With Auction Bars and Range Projections
November 19, 2024
Enhancing Your Automated Trading System: Key Insights from Best Pro Trade
November 14, 2024
NinjaTrader New Ecosystem Tools: October 2024 Edition
Enter Email for Updates