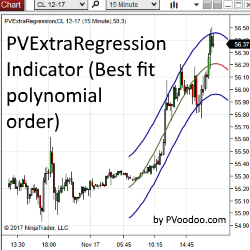
PVExtraRegression Indicator & Strategy is a regression channel taken to the next level, calculated using higher order polynomials. Use PVExtraRegression as a discretionary indicator or automated strategy!
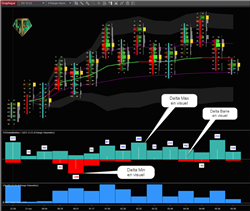
This indicator will visually tell you the evolution of this OrderFlow data: Delta / Delta Min / Delta Max. Ideal for detecting Delta divergences. No need to read the NinjaTrader statistics table anymore! Please note, you must have the NT8 version allowing access to OrderFlow.
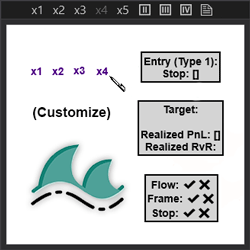
This indicator allows the user to create custom text buttons and quickly draw them on the chart, increasing application functionality and user charting efficiency.
No need to stare at the chart and wonder or make guesses - the Raptor will tell you! The Raptor detects potential trades for you out of the box and will alert you when these trades are setting up. This gives you plenty of time to get into the market with zero stress.
ChartVPS provides high-end virtual private servers (VPS) to traders, enabling them to automate strategies & securely trade from any device, anywhere 24/7. Our servers & network are built specifically for trading & NT platform, ensuring compatibility, ultra-low latency & smooth operation.
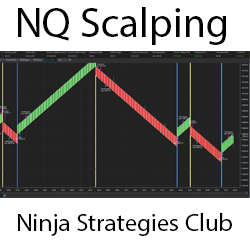
Open-source code can be developed. If you want, you can add different strategies on it. Lifetime free updates. Take-profit at three, five or seven ticks, stop-loss at 13 ticks. Change the take-profit and stop-loss settings.
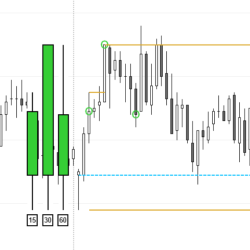
Price Action from higher time frames (5, 15, 30, or 60 min.) can point to a possible change of sentiment during the opening range. Higher time frame closing prices can be plotted on the trading chart to spot aggressive trading at these important prices. Get started with a 20-day free trial today!
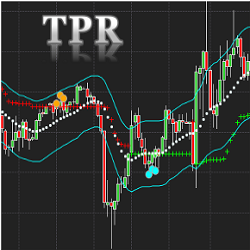
The Trend Pullback Reversal (TPR) Indicator displays possible price trends with pullback and reversal signals. TPR will focus on the main trend and filter out most minor price movements. The NinjaTrader 8 version comes with a unique band and center line as additional features.
This is the ultimate mean Renko version (with wicks) for NinjaTrader 8. It removes noise and helps visualize trends. ninZaRenko can be used for charting, trading, backtesting, and programming. It is trusted and loved by thousands of traders worldwide. Download free now!
Track volume weighted average prices (VWAP) over any time frame with the comprehensive Calendar VWAP indicator, featuring customizable settings for essential periods like MTD, YTD, WTD and more!
December 2, 2024
Mastering Sideways Markets With Auction Bars and Range Projections
November 19, 2024
Enhancing Your Automated Trading System: Key Insights from Best Pro Trade
November 14, 2024
NinjaTrader New Ecosystem Tools: October 2024 Edition
Enter Email for Updates
 from Indicator Warehouse.png)