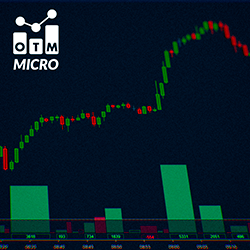
The OTM Micro Delta indicator allows you to identify buying or selling interest. With a reference threshold, it filters out significant movements. It is useful for detecting large price movements.
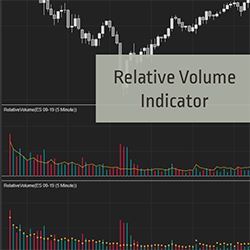
Detect unusual or below average volume easily. Identify the start or end of a move with no effort. Relative Volume (RVOL) compares current volume to the average volume for the same time of day. Start your 2-week trial now!
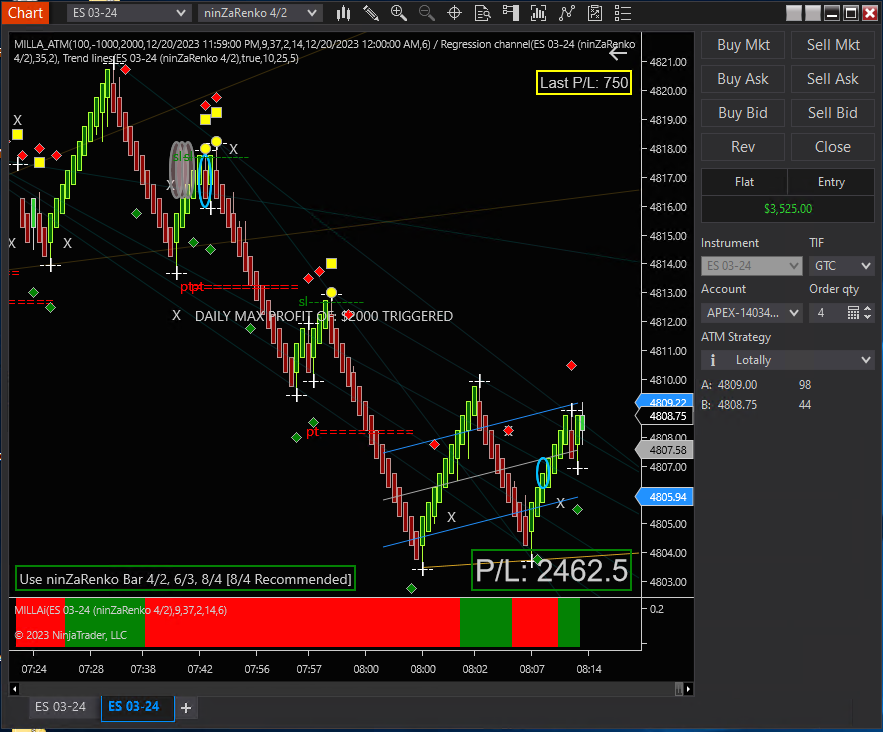
This fully-automated reactionary price and volume intraday trading strategy takes advantage of fluctuations of price, direction and momentum to currently trade the E-mini indices. We will be expanding into other futures, commodities and chart intervals in the near future.
The VTP was created to provide Veterans with an introduction to financial markets. The Stage 5 Online Course educates traders on how to approach their funding challenges within the Prop Firm space. It aims to helping support traders to succeed, and build a sustainable trading business.
Learn a battle-tested strategy for trading the markets in under 60 mins per day. Here’s just a fraction of what you’ll learn: How professional traders find good trades, how to read the markets and a market that has unique advantages over others.
Stocks, futures and forex trading analysis education via daily coaching and education using an institutional order flow methodology. Unlimited mentorship, an advanced curriculum course, trading software, forum and class recordings are all included! Learn More!
Visually add buying and selling pressure analysis and time & sales data to any chart. See the pace of the tape and order flow analytics in an easy to understand tape speed monitor format that allows you to quickly read the tape. The Geiger Counter is an instantaneous indicator of order flow shift.
Created to help aid momentum-style charting in finding support and resistance lines. It was specifically made for the ES when plotted with tick bars. This tool may help cut down on chart preparation time or get your chart caught back up if busy multi-tasking.
This innovative tool from candlestick guru, Steve Nison, instantly finds his favorite candle patterns on charts. The Nison Candle Scanner works on all asset classes. Traders save hours of research time, spotting candlestick pattern opportunities immediately. Choose a monthly or lifetime purchase!
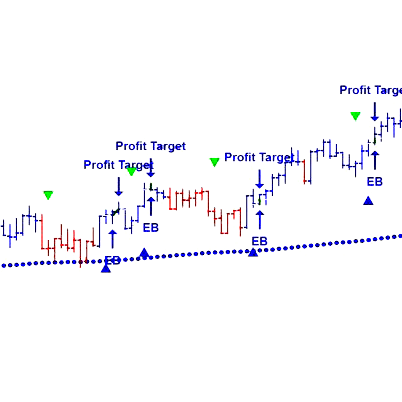
A full, automated strategy that controls its own "Take Profit," and also comes with an option to set your daily max profit and loss.
December 2, 2024
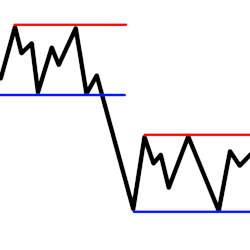
Mastering Sideways Markets With Auction Bars and Range Projections
November 19, 2024
Enhancing Your Automated Trading System: Key Insights from Best Pro Trade
November 14, 2024
NinjaTrader New Ecosystem Tools: October 2024 Edition
Enter Email for Updates