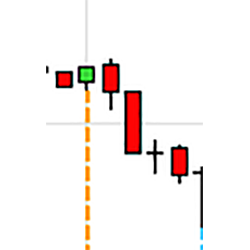
The LogikDynamicRange is a unique Range Bar with Dynamic Resizing capabilities. This is done by employing a non-lag range determination technique, continuously adapting the bar size throughout the day, capturing trends while displaying consolidation areas very easily.
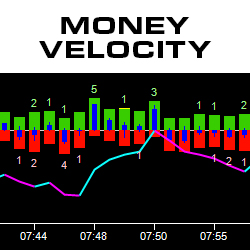
The Money Velocity indicator visually presents Time and Sales data. Easily see real-time bars featuring the number of sales at & above the ask price plus the number of sales at & below the bid price. Additionally, the indicator displays the difference, order flow trend and block trades. Learn More!
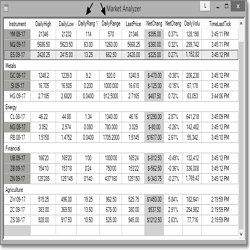
A Market Analyzer column that allows traders to view the daily range of an instrument in points or currency.
Several studies have found a connection between full and new moons and stock market performance. Knowing how and when to time the cycles in trend shifts is centuries old, but new to most traders.
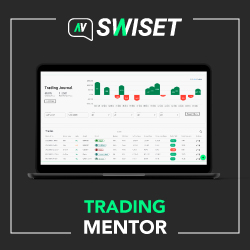
Trading Mentor is an automatic system based on data science which helps traders understand the most important insights of their trading and adjust their trading strategies for consistent results.
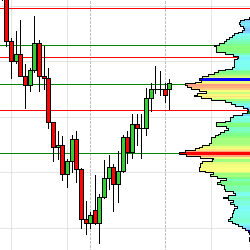
GomMPPro is a high-performance tick-based volume profiler. It offers many data points such as: HVN/LVN, POC, VWAP & VA. Additionally, it features customizable hotkeys allowing traders to quickly toggle between favorite settings. Free 2-week trial available.
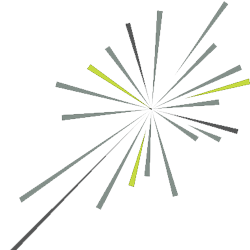
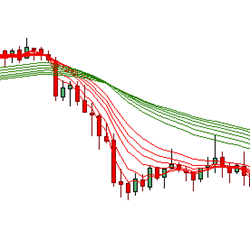
The Fanned Multiple Moving Average day trading indicator uses two sets of moving averages (long and short term) to calculate the probability of trend development, change, and direction. The FMMA reveals the nature of the trend and trend changes, which often reveals the starting point of a breakout.
Download a 14-day test period of this trading indicator that identifies points to enter the market for price pullbacks and reversals. The indicator uses pure price action, which makes it possible to get rid of lagging indicators. Be independent of the values and stage of the market.
The algorithm executes trades based on previously designed and projected levels from previous day to the next, providing a clear and predictable market structure and the trade it will be able to perform.
Auto Tab adds a Tab Link Selector to the top left portion of every Dom & Chart window. Simply click on the tab of any window, and all other windows (linked by color) will also change to that same tab! Simulate multiple workspaces with tabs and enable automatic sequencing with a configurable timer.
December 2, 2024
Mastering Sideways Markets With Auction Bars and Range Projections
November 19, 2024
Enhancing Your Automated Trading System: Key Insights from Best Pro Trade
November 14, 2024
NinjaTrader New Ecosystem Tools: October 2024 Edition
Enter Email for Updates