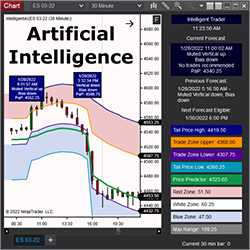
Intelligent AI uses a proprietary AIFS platform (Artificial Intelligence Forecast System). AIFS models are trained to learn the underlying structure of the market to forecast what may happen over the next six hours. Subscriptions also include access to Intelligent Trader's moderated Discord channel.
Universal Oscillator is an indicator that operates on the general principles of the RSI, CCI and OsMA oscillators. It helps you to identify potential upcoming reversals based on the values of the oscillator.
Their European open LTR targets the Nasdaq, S&P 500 and FDAX. They cater for new to expert traders. They combine a highly successful 5-minute chart trading technique with 15 & 60 minutes charts.
Manage your risk by setting drawdown limits and goals! If your drawdown limits are hit, the system prevents you from trading further. If your goal is hit, you can trade but never giving back more than your set amount. If hit, you're done for the day/week. This is your preset Dynamic Drawdown Limit.
The QTradez Consulting service offers guidance on the best way to create and support NinjaTrader add-on products. With over 10 years of NinjaScript development experience, QTradez consulting staff will deliver the exact information you seek as simply & cleanly as possible.
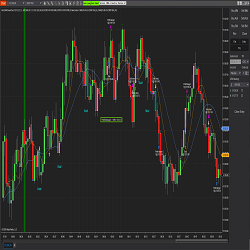
The SMA CrossOver Strategy is one of the simplest, for ease of use and understanding. This simple strategy has been amped-up to include current day price Highs and Lows, Traps, Consolidation, Long Bar and dynamic Bullish and Bearish trend algorithms for precision filtering to find the perfect entry.
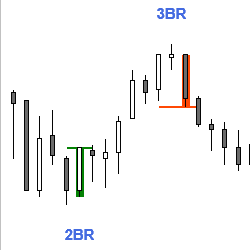
This indicator identifies 10 different signal bars or patterns for possible reversals by examining bar features and relation to prior bars. It can be used as a discretionary indicator or for automated (e.g. BloodHound) trading. Get started with a free 20-day trial today!
If you're still guessing what tick speed to use as an intraday trader, stop now, and start using the Tickspeedometer. The indicator instantly reveals the correct tick chart setting for all instruments and timeframes throughout the trading session. So, stop guessing, & start trading with precision!
MTPredictor offers a suite of Elliott Wave, Volume, Fibonacci & position sizing add-ons that allow traders to find & asses trades in the Futures, Stocks and Forex Markets. Sign up for a 15-day trial today!
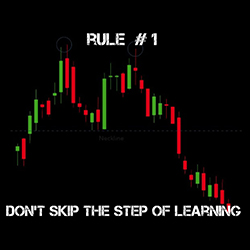
Gain an understanding of trading: market analysis, technical analysis, fundamental analysis, indicator trading, day trading/scalping, strategies, trading psychology, expectation and mindset, money management and risk management. Practice on a demo account. Referring trading brokerage/platform.
December 2, 2024
Mastering Sideways Markets With Auction Bars and Range Projections
November 19, 2024
Enhancing Your Automated Trading System: Key Insights from Best Pro Trade
November 14, 2024
NinjaTrader New Ecosystem Tools: October 2024 Edition
Enter Email for Updates