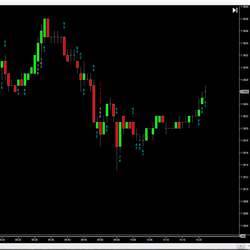
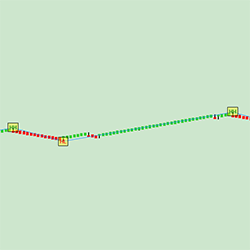
This NinjaTrader indicator is programmed to highlight the big money trades. The numbers are placed under each bar which makes it easy to see where the action/noise is taking place.
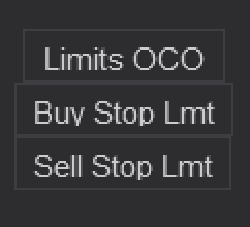
Bars Edge Trader Button and OCO Timer pack for NinjaTrader 8. An easy fast solution to apply Limit Orders to your Chart Trader. Included are three timers for adding OCO Limits entries throughout the day to catch a news cycles semi-automatically.
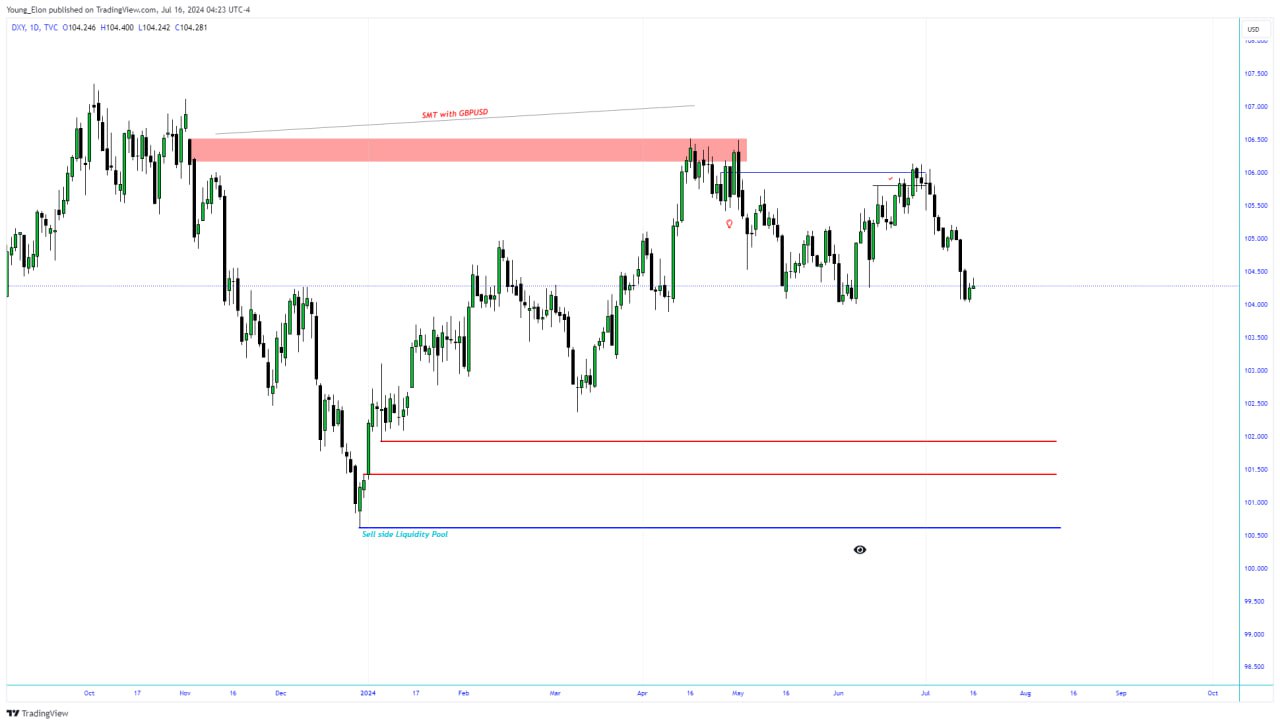
This is a YouTube channel, in which they share the precise models for smart money trading concepts. With the concepts, you can trade like the banks, by following their foot prints. With the models, you are able to see the specific footprints and in return trade like the institutions.
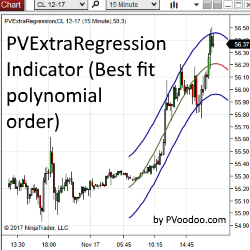
PVExtraRegression Indicator & Strategy is a regression channel taken to the next level, calculated using higher order polynomials. Use PVExtraRegression as a discretionary indicator or automated strategy!
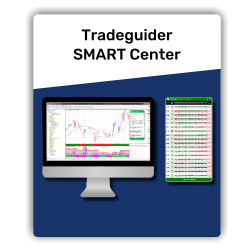
Unlock the power of Wyckoff VSA through an optimized package that uses SMART Technology to generate easy-to-use live alerts and preset approaches. Save 80% charting time with SMART Technology. Four easy-to-implement, rules-based strategies. SMART audible notifications for signals and setups.
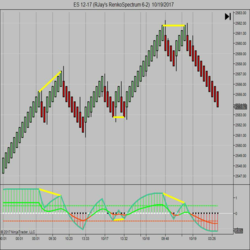
You can use this crème de la crème indicator to determine the dominant direction of price action and trend. It can be used on multiple timeframes for identifying qualities that must be present before a trade is considered.
The Trading Accelerator Mentorship program caters to new and struggling traders trying to find their way. Trading support, troubleshooting, training and live trading sessions to bring traders up to speed on the business of trading.
The Divergence Indicator offers combinations of single, double, and hidden divergence displays. Divergence measured is price action compared against a selectable NinjaTrader indicator. The selection list includes TRIX, RSI, CCI, RVI, MACD, TSI & more. Get a free trial now!
This 25+ Chapter Price Action Course plus 4 one-on-one hour long help sessions are designed to address trading hurdles you may be facing. This Couse Includes access to VIP discord, daily morning livestream, lifetime access to the course, and more!
This workshop will help you decide if trading could be for you. It demonstrates all aspects of trading - managing risk, trading techniques, technical analysis, trading psychology, creating a trading plan and what to include. Join in with your laptop or computer.
December 2, 2024
Mastering Sideways Markets With Auction Bars and Range Projections
November 19, 2024
Enhancing Your Automated Trading System: Key Insights from Best Pro Trade
November 14, 2024
NinjaTrader New Ecosystem Tools: October 2024 Edition
Enter Email for Updates