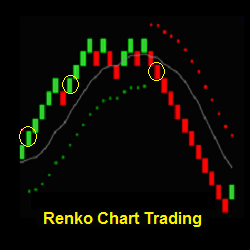
Renko Chart Trading offers day trading strategies, indicators and a training program focused on Renko charts. Learn the characteristics of how Renko charts can emphasize price, help filter chart noise and add clarity to trading. Join the Renko Trading Group today!
The ELITE Pack includes 44 in-depth Volume Profile training videos, 15 hours of video content and hundreds of real trade examples. Get intraday & swing Volume Profile levels, signals & video! It also includes access to the member forum and custom-built Volume Profile indicators for NinjaTrader 8.
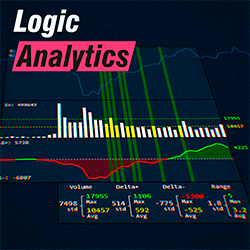
Visualize the relationship between delta and volume with accurate statistical calculations on delta, ask, bid, and volume. This tool combines the power of data analysis with advanced charting, allowing you to see the most relevant market movements.
Performs real-time analysis of the volume and price trends to color the lower panel of the chart with actionable information. When both are trending in the opposite direction, the panel will be colored purple to mark this "unusual behavior." Start using this key Information in your trade plan today!
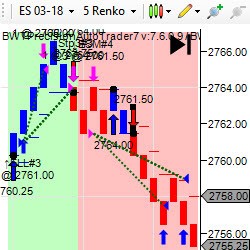
The BWT Precision Autotrader is a state of the art trading tool/software that automates most of the tasks of manual trading, like trail stops, daily goals, entries and profit targets. It uses a universal directional algorithm that brings accuracy, discipline, risk & money management to your trading.
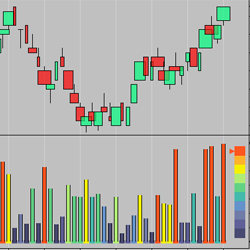
The IT_VolZoom, shown with IT_FatBars (uses same engine), shows volume level relative to the surrounding volume. The histogram is colored according to a 10 step heat meter which is shown on the right (bar colors optional). It accurately shows high volume even in low volume conditions.
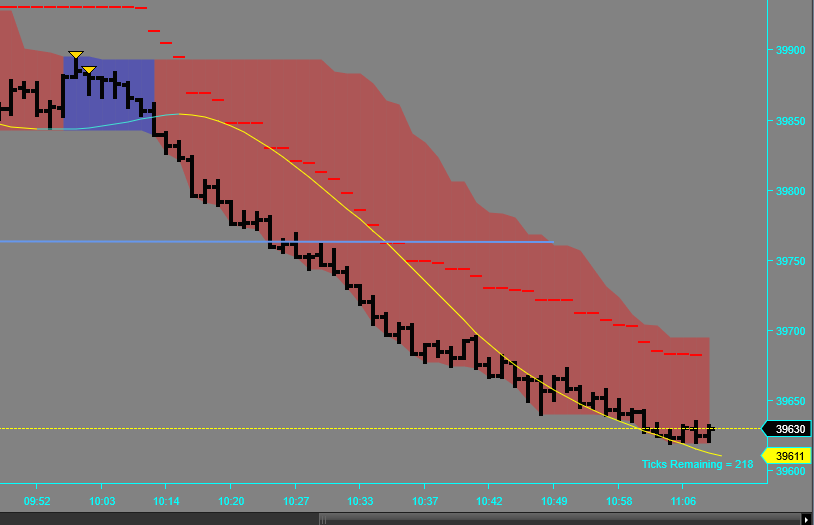
Shot Caller is a time- and volume-driven indicator, utilizing eight different data points to help identify potential short term trends in the market. Once engaged, the channel will be highlighted BLUE or RED and provide signal triangles to aid in the decision making process.
Swing MNTrader is a fully automated trading system. Trading is based on a moving average strategy with a filter system based on the stochastic RSI indicator. An improved position support system with flexible settings to improve trading consistency. Suitable for all Forex trading instruments.
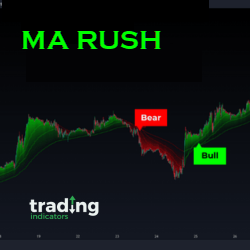
MA Rush is a trend-following indicator that provides intelligent multi-time frame analysis, adapting to different trading time frames. It predicts potential strong market trends, either uptrends or downtrends.
PriceIsKing.com's Futures RAM Indicator is based on a powerful moving average pattern recognition algorithm developed with years of research and testing. Get started with a free 2-week trial today!
December 2, 2024
Mastering Sideways Markets With Auction Bars and Range Projections
November 19, 2024
Enhancing Your Automated Trading System: Key Insights from Best Pro Trade
November 14, 2024
NinjaTrader New Ecosystem Tools: October 2024 Edition
Enter Email for Updates