Polaris Trading Group provides futures day trading education that includes an Online Study Course & Live Trading Room. Trading veteran and Commodity Trading Advisor (CTA), David D Dube, provides traders specific support & resistance levels & trade setups based on Market Profile and volume analysis.
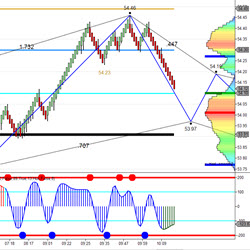
Get your trade information at-a-glance. Adding the Status Box on your chart allows you to see your relevant trade stats instantly.
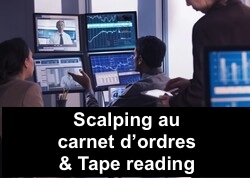
This training, accessible to beginners and experienced users, explains step by step how to properly read the Orderbook and the Tape. At the end of the training, you will have all the knowledge and trading strategies necessary to be able to trade with confidence and logic on the markets.
TradeTrend© provides entry & exit signals including trailing stop levels for stocks, futures and forex. This automated strategy can be used to make more informed and confident decisions for a wide range of options strategies and helps traders stay on the right side of the market & momentum.
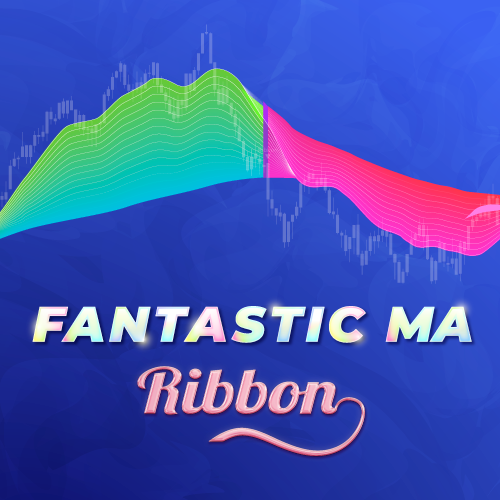
The ribbon-like indicator, Fantastic MA Ribbon, is created by plotting multiple moving averages (MA) with varying lengths. It incorporates four signal mechanisms, offering diverse options to align with your unique trading style.
Do you wish to diversify your trading by following in the footsteps of successful traders? Do you wish to keep your forex broker and still follow successful traders? Would you like to do this at a very reasonable cost? If you answered "Yes" then this is for you.
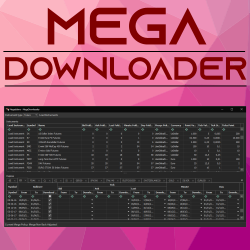
The MegaDownloader add-on allows you to download historical data asynchronously in a single window. Load instruments by type and view specifications and all available expiries for each instrument, including rollover period and date/time range for tick, minute, and day-based periods.
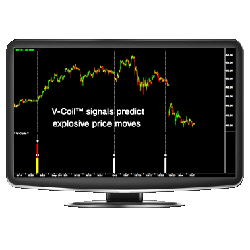
The V-Coils™ & NR Breakouts Indicator Package detects significant contractions and expansions in volatility and Average True Range (ATR). It issues signals when there is a very high probability for an explosion in volatility - leading to huge price moves that traders can take advantage of.
DataGrabber™ grabs price and volume data for any futures instrument. It is designed to work with the AI prediction software, AITrendPredictor™. DataGrabber™ data files get fed into AITrendPredictor™ to train the AI model to find patterns on price, volume, day and time to make a price prediction.
Would you like to learn how to code your own strategies, indicators, bar types, optimization algorithms and amazing .NET extensions? This course, taught by Yuri Zolotarev, contains over 60 lectures and more than 5 hours of content. In addition, we are always updating this program with new material.
December 2, 2024
Mastering Sideways Markets With Auction Bars and Range Projections
November 19, 2024
Enhancing Your Automated Trading System: Key Insights from Best Pro Trade
November 14, 2024
NinjaTrader New Ecosystem Tools: October 2024 Edition
Enter Email for Updates