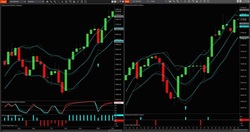
The IABands are envelopes similar in concept to the popular Bollinger Bands, only far more responsive. The direction and the width of the IABands gives an idea of when a financial instrument is trending versus not trending. The value of any band will very often turn out to be a strong reversal area.
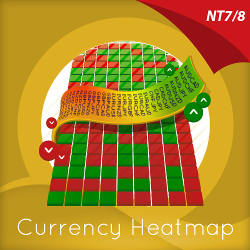
The Currency Heatmap displays the “hottest” and “coldest” areas of the forex landscape. Vertically, 28 currency pairs are listed and ranked from the most bullish to the most bearish. Horizontally, each cell then displays bullish and bearish sentiment across multiple timeframes instantly.
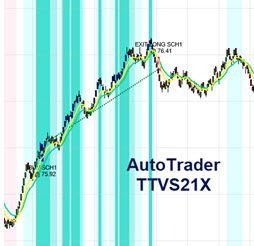
Comprehensive automated system, including 20 strategies, covering a broad range of instruments and market conditions. Includes indicators, color backgrounds and a powerful money management module to protect profit and principal. Lease includes training and support.
Unlike other static or lazy stop-loss tools, the Dynamic Trailing Stop (DTS) uses a proprietary “Smart-Stop” technology intended to help protect profits while minimizing risk. Customizable "Stop Proximity" setting lets trader control how tight to keep their stop-loss.
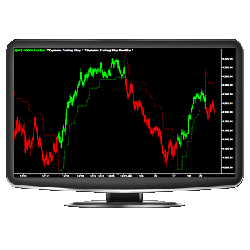
The Smart Momentum NinjaTrader Indicator tool has a unique design compared to other momentum indicators. It uses an averaging mechanism that analyzes the cycle and adapts to it. This results in a momentum plot that is simultaneously smooth and sensitive.
Did you realize that 95% of retail traders FAIL? The short answer to unlocking failure is learning how to manage emotions while trading. It's learning how to control that voice inside of you that causes you to chase trades, enter too early, revenge trade, FOMO, over trade, blow accounts, etc.
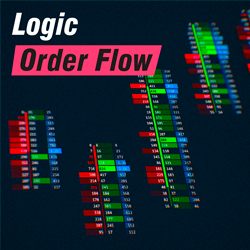
Logic order flow features unique and easy-to-use graphical options, one-click presets and configurations, a profile, footer, and databox for a complete market analysis. It guarantees the best visualization of patterns and zones, making this tool one of the best options on the market.
Don't miss any more targets by a few ticks with Target Zone!
Unlock the secrets of successful trading with the latest version of the Order Flow Trading Setups eBook. Dive into over 12 unique order flow setups, each detailed with examples and entry points. This guide offers practical setups used in daily trading and clear screenshots for each pattern.
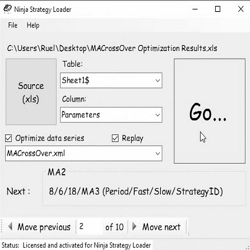
The Ninja Strategy loader allows traders to quickly and accurately load strategies into the NinjaTrader Strategy Tab or Chart Windows. Learn more!
December 2, 2024
Mastering Sideways Markets With Auction Bars and Range Projections
November 19, 2024
Enhancing Your Automated Trading System: Key Insights from Best Pro Trade
November 14, 2024
NinjaTrader New Ecosystem Tools: October 2024 Edition
Enter Email for Updates