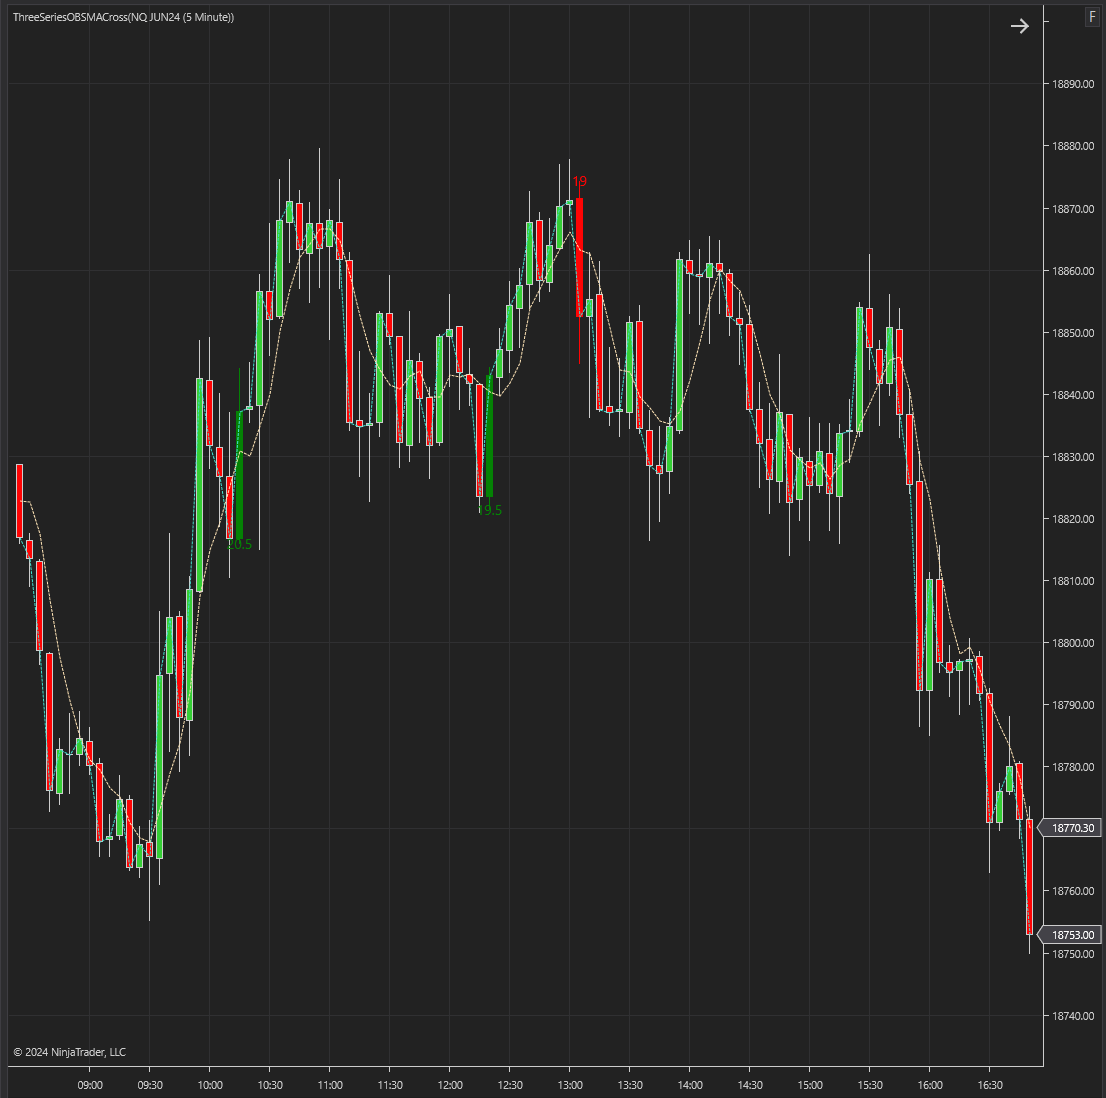
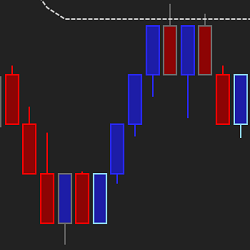
This Indicator is a sophisticated tool designed to help traders identify and capitalize on bullish and bearish market trends. By combining Simple Moving Averages (SMA) and engulfing pattern detection, this indicator provides clear and actionable signals for entering and exiting trades.
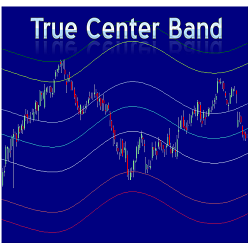
The True Center Band (TCB) indicator shows the trend, different levels of support and resistance and the boundary of price action. The TCB is designed to work on all intraday and daily charts as well as any market.
Welcome to the 7 Steps for Consistent Trading Performance. This free 7-day video course teaches about the three strategy stats based on probabilities to help you build a sustainable, scalable and reproductive (SSR) strategy for achieving consistent performance.
If you seek a trend-following system capable of minimizing failed entry signals in choppy markets, your search ends with RK-System Platinum v4. This system provides up to 4 signal types, with the price action signal type proving to be particularly reliable and productive in our backtesting.
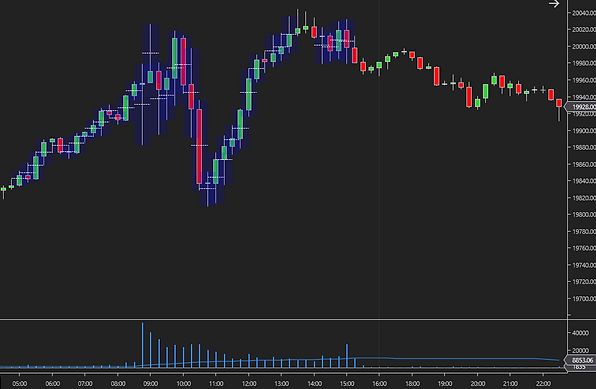
Elevate your trading strategy with the ATS Average Volume Pro indicator. This powerful tool showcases average volume with a customizable Simple Moving Average (SMA) and highlights each bar with above-average volume, making it easier for you to spot significant market moves.
An ebook that explores my operational strategy in the financial markets, with a focus on technical analysis, operational management and practical techniques. The goal is to gain more awareness and master a style that would otherwise be more complex and require more time.
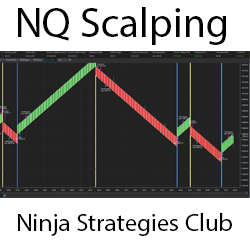
Open-source code can be developed. If you want, you can add different strategies on it. Lifetime free updates. Take-profit at three, five or seven ticks, stop-loss at 13 ticks. Change the take-profit and stop-loss settings.
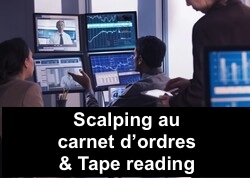
This training, accessible to beginners and experienced users, explains step by step how to properly read the Orderbook and the Tape. At the end of the training, you will have all the knowledge and trading strategies necessary to be able to trade with confidence and logic on the markets.
Track volume profile in three timescales easily! Optimal Vision analyses point of control and value area breakouts in three rolling lookback periods of your choice and color-codes your bars by strength of signal. A simple way to bring dynamic volume profile to your trading! Strategy compatible.
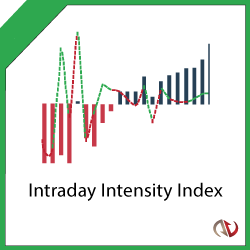
This awesome indicator allows traders to spot institutional block trades (buy and sell). It provides confirmation for impeding trend reversals and avoids premature or false reversal signals. Intraday Intensity Index is recommended by John Bollinger to supplement the Bollinger Bands™ indicator.
December 2, 2024
Mastering Sideways Markets With Auction Bars and Range Projections
November 19, 2024
Enhancing Your Automated Trading System: Key Insights from Best Pro Trade
November 14, 2024
NinjaTrader New Ecosystem Tools: October 2024 Edition
Enter Email for Updates