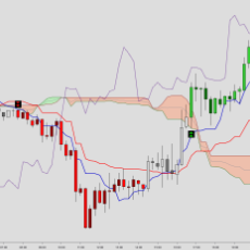
The Ichimoku Kinko Hyo, also known as the Ichimoku Cloud, is a versatile indicator that defines support / resistance, trend direction, momentum and trade signals. One can also think of this indicator displaying momentum in 5 separate time-frames.
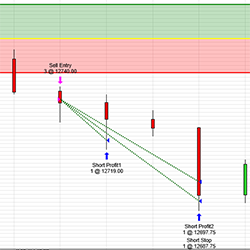
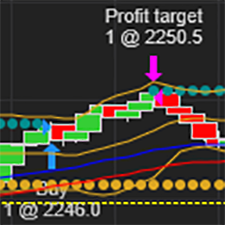
This strategy will trade the opening range and provide targets and stops. It will also trail after each target is hit. The trail and stop levels can be customized as well as the targets.
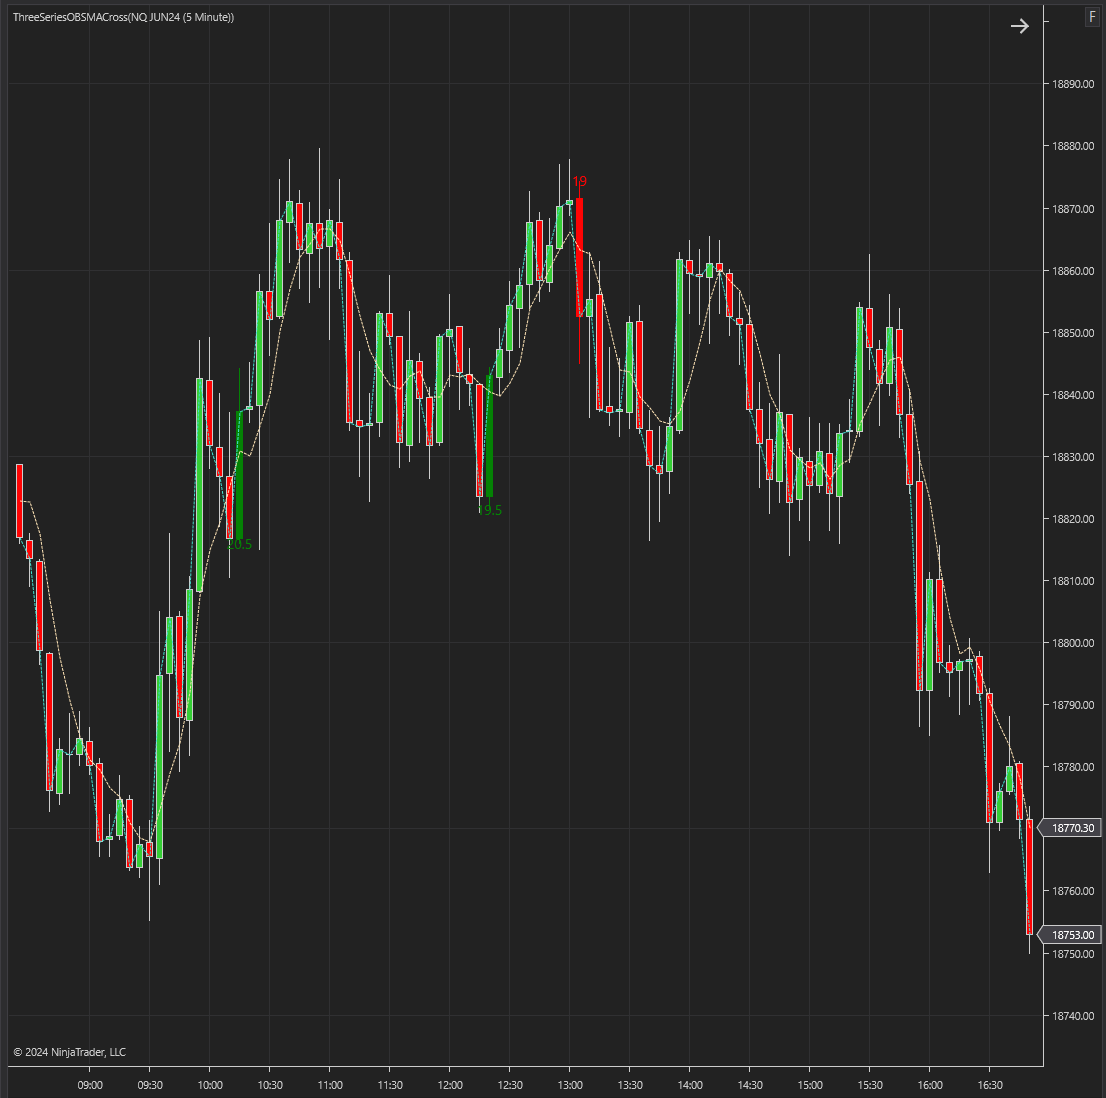
This Indicator is a sophisticated tool designed to help traders identify and capitalize on bullish and bearish market trends. By combining Simple Moving Averages (SMA) and engulfing pattern detection, this indicator provides clear and actionable signals for entering and exiting trades.
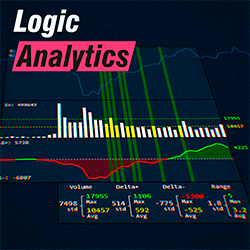
Visualize the relationship between delta and volume with accurate statistical calculations on delta, ask, bid, and volume. This tool combines the power of data analysis with advanced charting, allowing you to see the most relevant market movements.
The Exhaustion Absorption Detector, which is based on live time and sales data, is designed to display order activity between the bid and offers at market price.
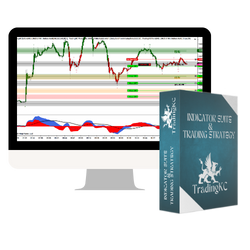
Simplify your trading with my strategy: trend, price action, support/resistance and momentum. Green/red bars indicate trend, custom ExCon indicator manages setups, pivots show support/resistance and MACD ties it all together. Clear entries, take profits and exits with simple rules for engagement.
This is a UNIVERSAL solution to regular divergence trading. Divergences can be identified by comparing price action and an oscillator of your choice. Yes, you can freely use this NinjaTrader divergence indicator with RSI or MACD, stochastic, CCI, and other indicators, from any vendors!
This model balances four separate risk lenses that seek to generate alpha while moderating standard deviation over multi-year periods. Each risk lens is independently applied based on Alpha Vee's breakthrough fundamental momentum research. Contact Alpha Vee for more information.
Price Action Harvester™ scans all markets to find consistent price action patterns based on historical data. Know how price moved for any instrument on particular days, during particular time-frames. A powerful tool for day traders. Don't miss this indicator!
Are you tired of only being able to trade futures manually? We have a fully Otter-mated strategy, so you can make trades while you sleep or do the things you enjoy! Try it now with our special introductory period for your first three months.
December 2, 2024
Mastering Sideways Markets With Auction Bars and Range Projections
November 19, 2024
Enhancing Your Automated Trading System: Key Insights from Best Pro Trade
November 14, 2024
NinjaTrader New Ecosystem Tools: October 2024 Edition
Enter Email for Updates