Collect MAE/MFE data where NinjaTrader leaves off. Get the ability to measure your moves after you're out of the trade.
With a potential of 1 trade per day, this system is automated from start to finish & designed to be monitored in some capacity. If you can remotely access a computer with the right software, then you can monitor these automated trades from the golf course (with a strong cell signal).
Visually add buying and selling pressure analysis and time & sales data to any chart. See the pace of the tape and order flow analytics in an easy to understand tape speed monitor format that allows you to quickly read the tape. The Geiger Counter is an instantaneous indicator of order flow shift.
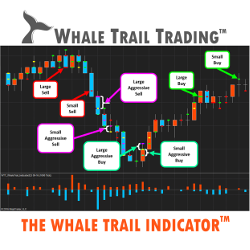
Let the Whale Trail Indicator replace years of reading trading books, attending lengthy and expensive seminars and unsuccessfully trading the markets. Easily follow the order flow in real time. Finally see how the largest whales trade the markets. Claim your free trial today!
This trading book is for the those traders struggling with psychology and entries with practical examples provided.
Share Service in NinjaTrader 8 is a secure file sharing platform specifically designed for the NinjaTrader 8 trading platform.
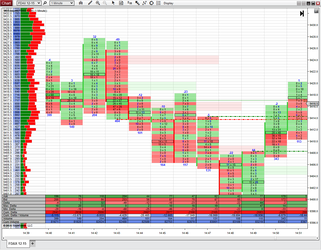
Pure and simple footprint (aka market profile or order flow chart) and volume profile chart add-on for NinjaTrader. Displays bid and ask volume traded at each price at each bar. Alternative charts – range, volume and tick charts - are also fully supported.
The Neu Algo System can be used to trade Prop Firm challenges or in a live-account. The system is built for active retail traders trading "tick-by-tick" in the Futures market. The system is designed for visual efficiency for trading in fast markets. It offers a choice of manual or automated trading.
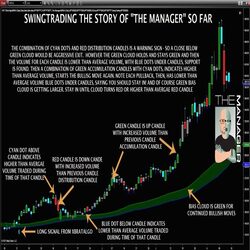
The Manager helps with simple and repeatable trade management. Using a number of tools like average volume, volume distribution or accumulation and an adjustable BIAS cloud, it can help you evaluate whether the market is reversing or just pulling back.
Do you wish to diversify your trading by following in the footsteps of successful traders? Do you wish to keep your forex broker and still follow successful traders? Would you like to do this at a very reasonable cost? If you answered "Yes" then this is for you.
December 2, 2024
Mastering Sideways Markets With Auction Bars and Range Projections
November 19, 2024
Enhancing Your Automated Trading System: Key Insights from Best Pro Trade
November 14, 2024
NinjaTrader New Ecosystem Tools: October 2024 Edition
Enter Email for Updates