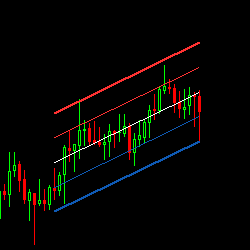
The Linear Regression Channel (LRC) trading indicator gives objective buy & sell signals based on price volatility. The upper and lower channels (linear regression lines) can be used to enter & exit the market in potential reversal zones. Add this to your chart today.
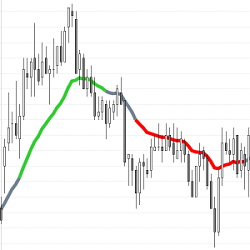
This indicator uses recent bar closes to calculate the “Always In” direction to help traders determine market trends. Use the Simple Always In EMA as a discretionary indicator or for automated trading. It is FREE to download and use!
This model balances four separate risk lenses that seek to generate alpha while moderating standard deviation over multi-year periods. Each risk lens is independently applied based on Alpha Vee's breakthrough fundamental momentum research. Equities are from small/mid cap universes.
With decades experience as an active trader & accredited coach, Mandi understands what it takes to build a successful trading career. She specializes in coaching HedgeFund, Prop, Bank & Private Traders around the globe in the essential mindset aspects of trading.
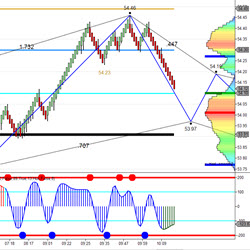
Polaris Trading Group provides futures day trading education that includes an Online Study Course & Live Trading Room. Trading veteran and Commodity Trading Advisor (CTA), David D Dube, provides traders specific support & resistance levels & trade setups based on Market Profile and volume analysis.
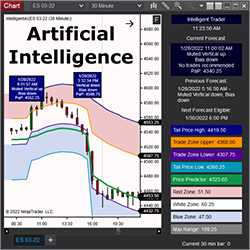
Intelligent AI uses a proprietary AIFS platform (Artificial Intelligence Forecast System). AIFS models are trained to learn the underlying structure of the market to forecast what may happen over the next six hours. Subscriptions also include access to Intelligent Trader's moderated Discord channel.
ThunderZilla is a user-friendly trading system designed to enhance your pullback trading. It integrates essential features for a well-rounded approach, including trend identification, entry signals, stop placements, targets, and trailing stops.
Do you spend hours reviewing charts and performing repetitive analysis and/or trade management? Why not define your trade setups and let me code them so that you get an alert each time a setup presents itself? Even have them built into an automated strategy.
Spot the calm before the storm for both breakouts and breakdowns with this ultimate volatility indicator! Spot bullish accumulation and consolidation points before strong upward breakouts and continued bullish trends. Find points of failing strength at plateaus and tops before drops.
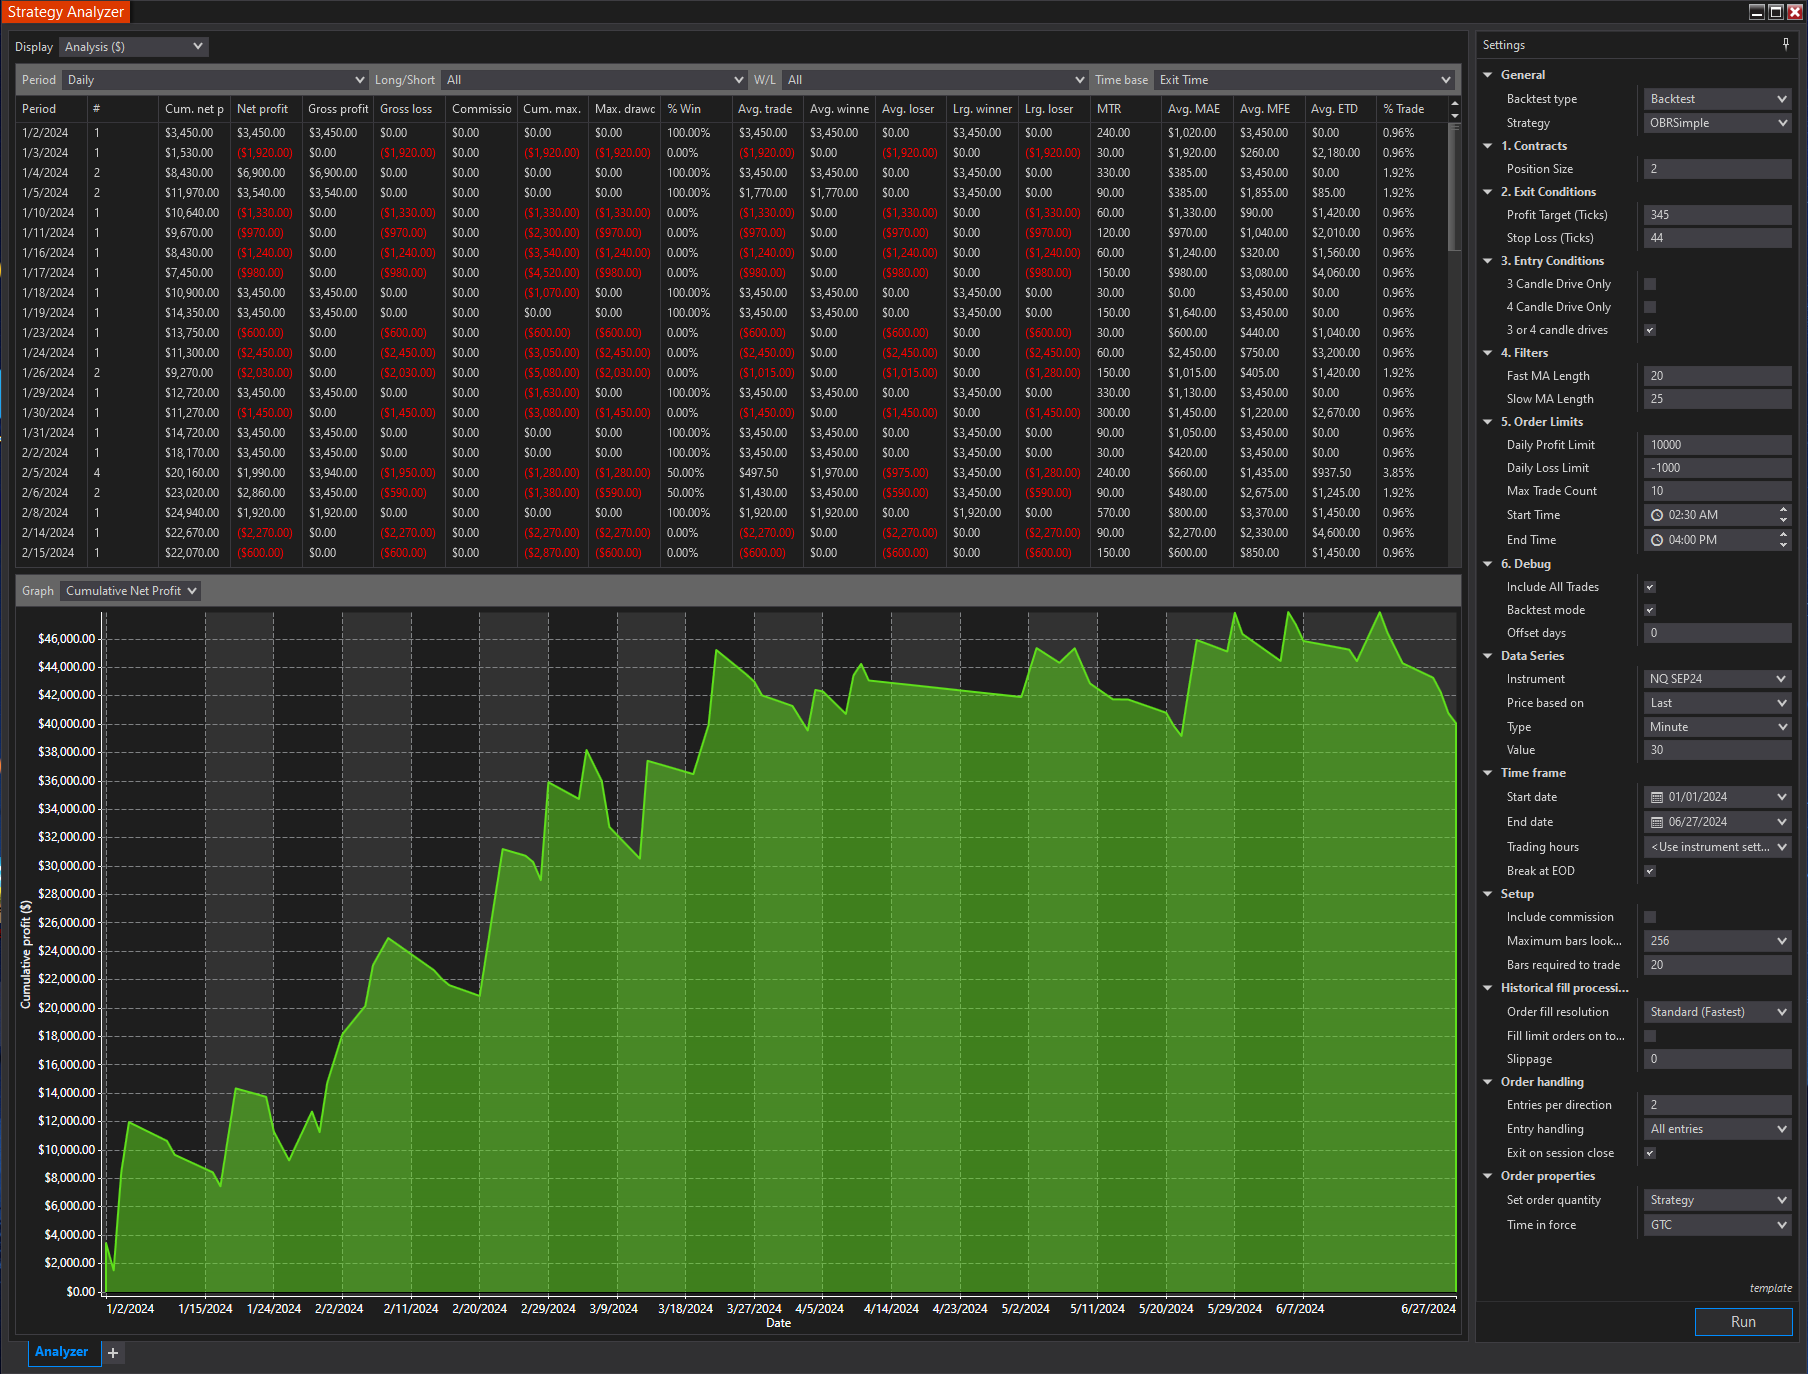
The Order Block Reversal strategy harnesses advanced market analysis techniques to identify and capitalize on bullish and bearish trends effectively. By integrating engulfing pattern detection and strategic entry points, this strategy offers clear signals for optimizing your trading decisions.
December 2, 2024
Mastering Sideways Markets With Auction Bars and Range Projections
November 19, 2024
Enhancing Your Automated Trading System: Key Insights from Best Pro Trade
November 14, 2024
NinjaTrader New Ecosystem Tools: October 2024 Edition
Enter Email for Updates