Toni Hansen is uniquely positioned to share over two decade’s worth of trading secrets, methodologies and financial strategies with clients in this highly interactive and market-focused learning environment.
VWAP MNTrader strategy is a fully automated trading system. Trading is based on the VWAP indicator for the daily, weekly and monthly periods on the breakdown test strategy with a filtering system. It has an improved position support system with flexible settings to improve trading consistency.
This trading masterclass delivers all the fundamental knowledge and trading skills as the foundations on which to develop your trading career for financial, commodity and digital asset classes. Up to one year to complete. Includes a free trading challenge to qualify for a funded trading account.
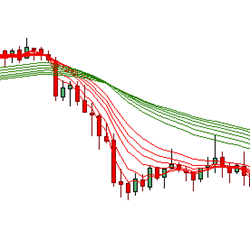
The Fanned Multiple Moving Average day trading indicator uses two sets of moving averages (long and short term) to calculate the probability of trend development, change, and direction. The FMMA reveals the nature of the trend and trend changes, which often reveals the starting point of a breakout.
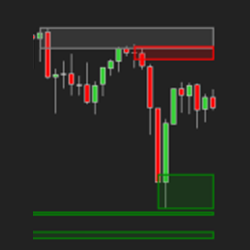
Q-PZone provides visual naked volume point of control (VPOC) zones. These VPOC zone levels are significant because they can act as a support or resistance level.
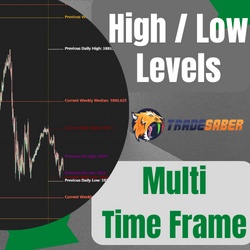
This indicator marks the High/Low median of the previous candle in various time frames. Options include: 1 min, 5 min, 15 min, 30 min, 60 min, 240 min, previous daily, current daily. previous weekly and current weekly.
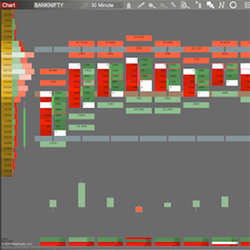
The Bell Order Flow-PRO is a toolkit of optimized order flow and volume visualization. It offers some of the unique features like BidxAsk Ladders, High Volume Alert, Volume Imbalance, Volume Spread Analysis, Delta Candles, Volume Profile, COT, Contract Reversal and customizable chart colors.
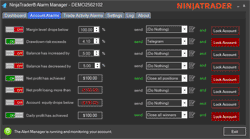
The NinjaTrader Risk Manager is a personal trading assistant for your PC, designed to perform various automated tasks. These include setting alarms for account and trade activities, initiating account lock-outs, and alerting you when your account is at risk.
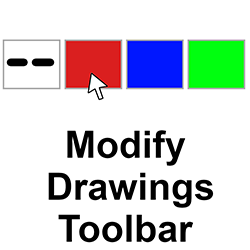
Trying to change line types and colors requires opening the properties box. It's also tricky to set a line or ray to be exactly horizontal. This toolbar contains various tools to help with those frequent property changes. It will even move your object endpoint to the chart's end.
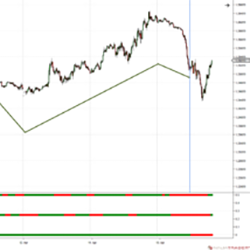
The EnlightCoders HeadScalper gives you market direction with a traffic light plot – red or green. SAT (Scalp Auto Trend) is a versatile and self-adapting tool to identify what is happening in the big picture. It reduces noise with smart filters and shows just one thing: the trend in red or green.
December 2, 2024
Mastering Sideways Markets With Auction Bars and Range Projections
November 19, 2024
Enhancing Your Automated Trading System: Key Insights from Best Pro Trade
November 14, 2024
NinjaTrader New Ecosystem Tools: October 2024 Edition
Enter Email for Updates