This is an excellent indicator in the S/R family. It was made with swing points, the visual concept of Market Profile, and their proprietary algorithm. The final result is a tool that can find outstanding S/R zones. It helps traders traverse the market, much like a radar helps a plane navigate.
Volume odometer on your chart. Identify a sliver of volume from your preferred volume source directly on your chart.
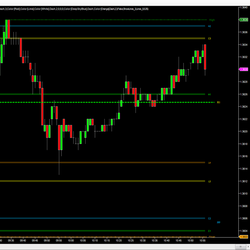
The DTB Trading Lines indicator conveniently plots (1) Standard pivot points (2) Last 5 days highs, lows, and closes, (3) Todays open price (4) High and low of current day.
When MFI, RSI, and Stochastic converge, the background is colored, signifying the overlapping zone and triggering immediate alerts via chart markers. This visually appealing and efficient tool excels beyond conventional oscillator applications, optimizing chart space for essential information.
With a potential of 1 trade per day, this system is automated from start to finish & designed to be monitored in some capacity. If you can remotely access a computer with the right software, then you can monitor these automated trades from the golf course (with a strong cell signal).
Free Discord EdsRetracePlan with Markers Plus CHAT. Using a single indicator and Range charts, you can automate CL, NQ and GC trade entries by turning on Markers Plus. Trades will be taken using the ERP long or short signals. Talk in the free Discord chat about how easy it is to trade with ERP & MP.
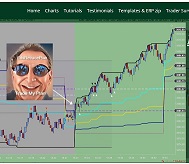
The Helix strategy is the combination of our Entry Zone indicator and the Trade Management strategy, hence the name Helix (or double Helix). Helix allows you to create your Entry Zones based on your setup rules. Then, after trade execution, Helix will manage the trade based on your rules.
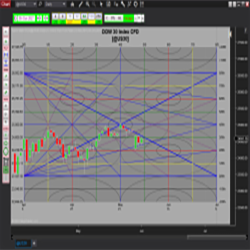
Samri Math Price-in-Time is a comprehensive tool for traders using Murrey Math methodology. This indicator calculates not just PRICE levels, but also sets the price in TIME. Easily switch between time frames (day or minute only) with the user-friendly interface.
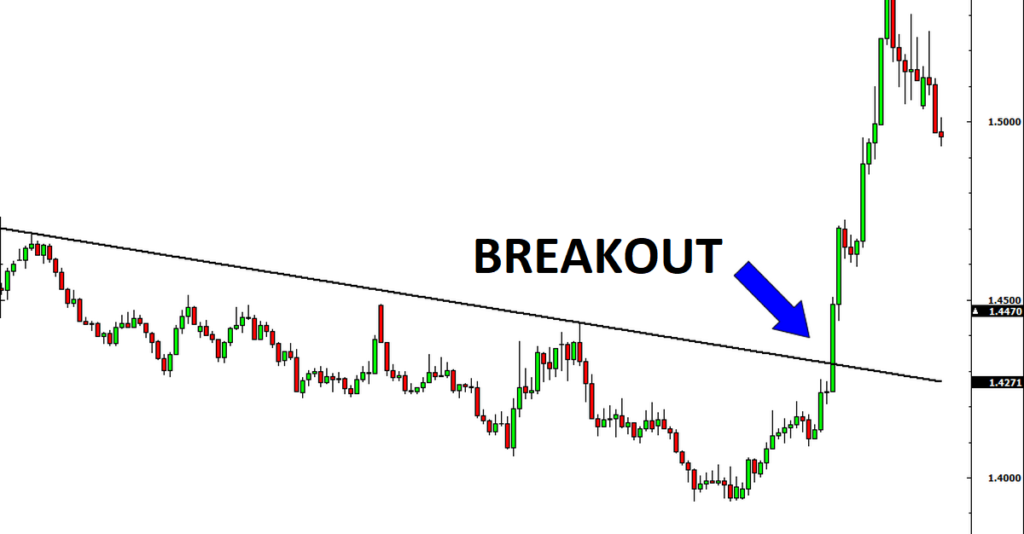
A breakout system to identify key points at which the price breaks previous resistances. This intraday NinjaTrader breakout strategy identifies intraday key levels and open positions when the price breaks through.
Learn from 25+ chapters that take you from A-Z, showing traders three go-to entry signals that are seen on all time frames. Join for lifetime access, yearly updates, VIP Discord access, live morning analysis stream, and more!
December 2, 2024
Mastering Sideways Markets With Auction Bars and Range Projections
November 19, 2024
Enhancing Your Automated Trading System: Key Insights from Best Pro Trade
November 14, 2024
NinjaTrader New Ecosystem Tools: October 2024 Edition
Enter Email for Updates