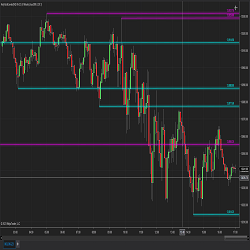
This algorithm calculates the support and resistance based on a look back period (number) of candles or bars and determines the support and resistance levels dynamically.
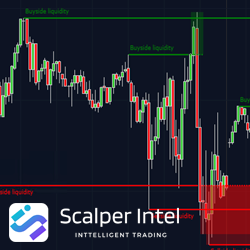
Unlock your trading strategy's potential with the Buyside & Sellside Liquidity Indicator. Gain deep insights into liquidity dynamics in ICT Trading methodology. Key features include Buyside and Sellside liquidity levels, revealing support and resistance zones, and Liquidity Voids.
Peaks is a powerful market indicator meticulously designed to identify precise tops and bottoms of price movements. Using sophisticated analysis techniques it pinpoints potential reversal points in the market. Peaks empowers traders to optimize entries & exits, making trading decisions confidently.
By subscribing to our Indicator Spotlight traders get a free monthly download from the LizardIndicators indicator library. All indicator features are documented with an explanation on how the indicator can be used in a trading strategy. Sign up today!
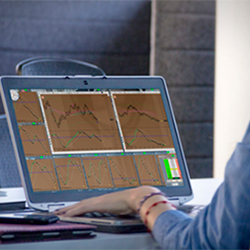
With a potential of 1 trade per day, this system is automated from start to finish & designed to be monitored in some capacity. If you can remotely access a computer with the right software, then you can monitor these automated trades from the golf course (with a strong cell signal).
The Quantum Dynamic Volatility indicator paints volatility as price action unfolds - no more guesswork, no more nasty shocks. Watch and wait, then trade with this safety-first indicator!
You can draw the risk/reward roulette tool at any point on a candlestick chart simply by clicking on the chart with the middle mouse button. This indicator allows you to speed up the drawing of the risk/reward tool on the chart by times, expanding on the functions of the trading platform.
Specializes in developing add-ons, indicators and automatic strategies for the NinjaTrader trading platform. With these innovative solutions, they help traders enhance their trading strategies. DevNT is formed by traders and they use their experience in the market to help you to shape your solution.
E-Mini Tutor offers three 1 on 1 Day Trading Education options aimed at traders who are interested in understanding the markets. The Pivot based trading methodologies strive to forecast market moves before they occur empowering traders to work smart, not hard. Enroll today!
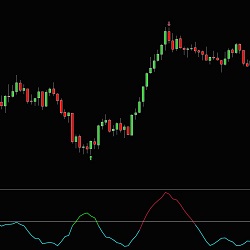
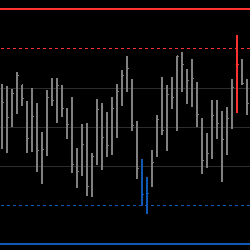
The Value Chart Indicator draws bars over a dynamically created scale from the last highest to the lowest values over a period. It attempts to spot market oversold and overbought areas on a short time scale, when price is most probable to revert to its mean.
December 2, 2024
Mastering Sideways Markets With Auction Bars and Range Projections
November 19, 2024
Enhancing Your Automated Trading System: Key Insights from Best Pro Trade
November 14, 2024
NinjaTrader New Ecosystem Tools: October 2024 Edition
Enter Email for Updates