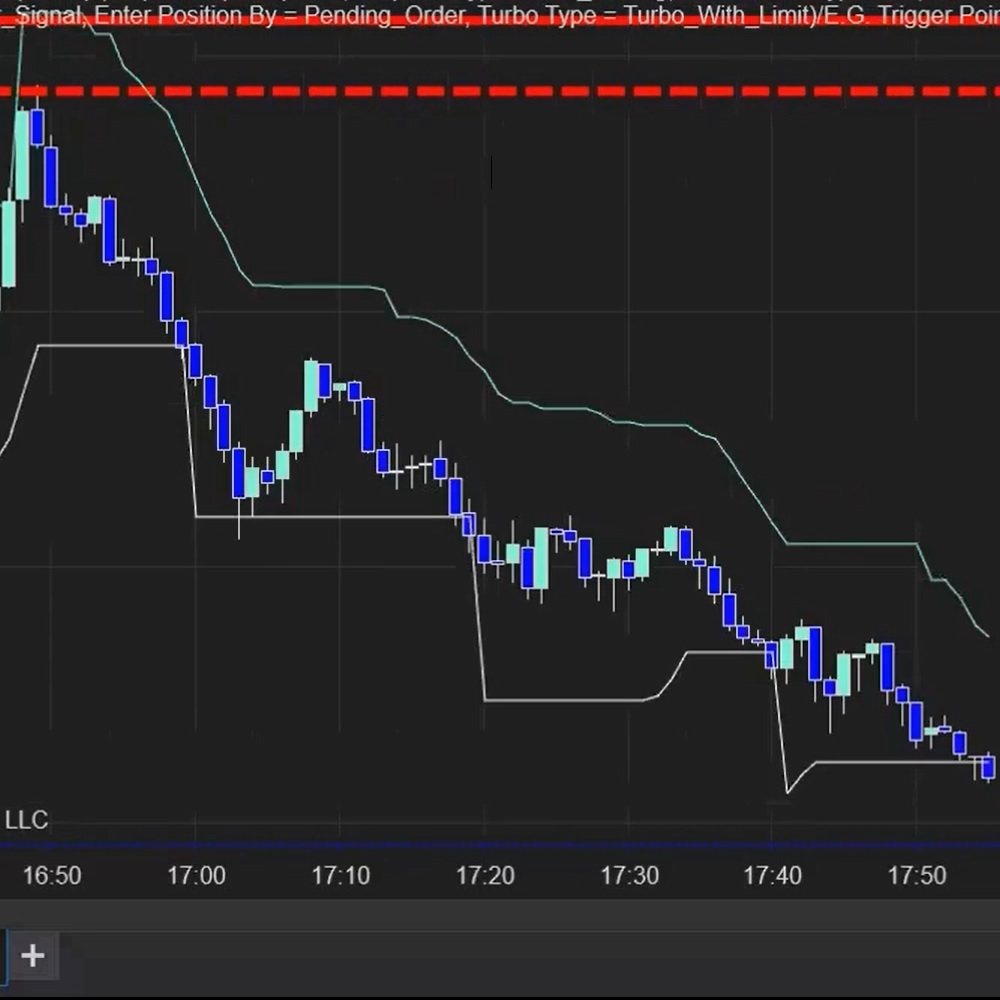
The E.G. Trailing Stop draws the trailing path for you. It considers the asset’s volatility; based on the Average True Range (ATR), it estimates the next price level to optimize your profit targets.
Pick from 8 different bar charts, offering features found nowhere else. Customized renko, range, tick, and time-based charts are available. Most charts have unique chart styles included (classic candle, price action, and xray). Get a free trial now!
The EPyFToolbar provides the capacity to execute many commands with a single click, such as enable/disable Chart Trader, hide all indicators from your chart, hide past trades, hide drawing objects, and more. Simply load the toolbar in one chart window and it will appear in every tab.
George Douglass Taylor thoroughly studied the markets and developed a sophisticated strategy for trading them. His method has been handed down over the generations as the "Taylor Trading Technique" and is widely recognized as one of the most solid fundamental old school trading approaches.
Did you realize that 95% of retail traders FAIL? The short answer to unlocking failure is learning how to manage emotions while trading. It's learning how to control that voice inside of you that causes you to chase trades, enter too early, revenge trade, FOMO, over trade, blow accounts, etc.
The Oil Trading Room is a product of Robbins World Cup Champion Trader Rob Mitchell. It has a unique Scientific approach with Trading Signals, Indicator applications using Market Profile, Price Action, Order Flow, Momentum, Order Flow Momentum, Support Resistance, Market Mapping and more.
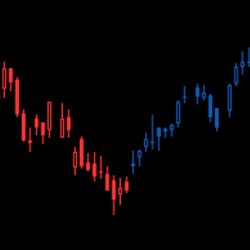
Our trend indicator was designed to offer an easier way to look at candlesticks on a trading chart. It uses a Heiken Ashi formula to improve the visualization of trends & aims to help spot trading opportunities more easily. Its visual approach provides a better picture of the trend. Get it today.
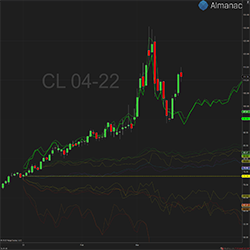
Accrue Inc. didn’t invent seasonality – they just made it easier to see and trade! Almanac™ Calendar Analytics creates better awareness of seasonality with 90-day price projections across five different market scenarios.
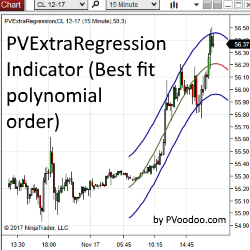
PVExtraRegression Indicator & Strategy is a regression channel taken to the next level, calculated using higher order polynomials. Use PVExtraRegression as a discretionary indicator or automated strategy!
Free Room includes sessions to learn trading tips, watch live markets, and news releases. There are evening and early morning special sessions to prepare for the day, and week ahead. See live market setups and learn how to manage risk and trades.
December 2, 2024
Mastering Sideways Markets With Auction Bars and Range Projections
November 19, 2024
Enhancing Your Automated Trading System: Key Insights from Best Pro Trade
November 14, 2024
NinjaTrader New Ecosystem Tools: October 2024 Edition
Enter Email for Updates