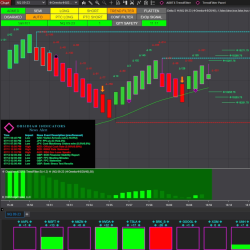
Performs real-time analysis of the volume and price trends to color the lower panel of the chart with actionable information. When both are trending in the opposite direction, the panel will be colored purple to mark this "unusual behavior." Start using this key Information in your trade plan today!
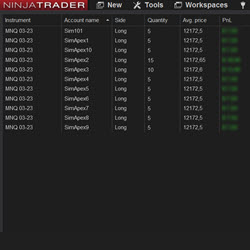
With this tool you can copy your own trades to multiple accounts from the same broker. If you use Propfirms with multiple accounts this is a must have for you. You can trade up to 20 accounts, open orders between different instruments, and have the possibility for an order multiplier.
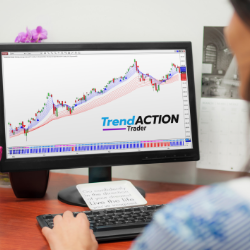
Trend Action Trader keeps you on the right side of the market with clear high probability signals for all markets and timeframes. Its price patterns and momentum algorithm are ideal whether you trade short or long term. Improve your trading consistency - try risk-free for 30-days!
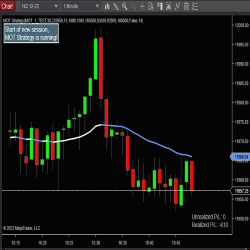
MightyOxTrading Strategy is an automated trading strategy for NinjaTrader 8. It has the option to use higher-timeframe bars as a filter for potential trades. It uses an ATM strategy for order management, so you can configure it for a single contract or for multiple contracts using a "runner".
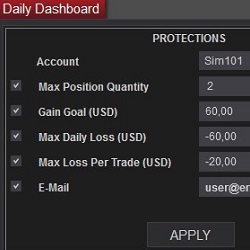
Protect your losses in a trade and daily basis. Do not grow a position more than planned. Daily Dashboard is the tool to support you against your bad behavior in the stressful moments.
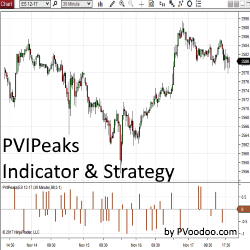
PVIPeaks Indicator and Strategy pinpoints peaks from any standard NinjaTrader indicator and allows traders to use them to generate a signal for an automated strategy. This tool is available exclusively for NinjaTrader 8. Get your free trial today!
Unleash the power of automated trading with the Obsidian Indicator Suite for NinjaTrader 8. A collection of innovative indicators, including the Automated Dark Diamond Trend Sniper, specially designed for precision and adaptability in different market conditions. Start your 7-day free trial now!
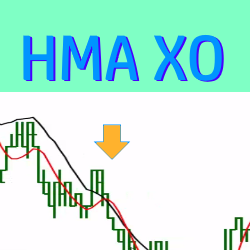
This trade setup indicator paints entry signals each time a Hull Moving Average (HMA) crossover occurs. The entry signals are customizable and can be filtered by the slope of the linear regression. Click here to watch a video and lean more!
This is a NinjaTrader 8 Machine Learning Code for developers. Code is opensource and machine learning is done by the Naïve Bayes algorithm. Learning is based on trendlines, price change, volume and stochastics. Any input/data can be added to the learning process.
Day Trading Radio is a live online market broadcast led by John Kurisko, a full-time trader of nearly 25 years. The show kicks off every morning around 8:30 am (EST) with live trading and technical analysis of the markets in real time. Get trade alerts and trade with 100’s of traders every day.
December 2, 2024
Mastering Sideways Markets With Auction Bars and Range Projections
November 19, 2024
Enhancing Your Automated Trading System: Key Insights from Best Pro Trade
November 14, 2024
NinjaTrader New Ecosystem Tools: October 2024 Edition
Enter Email for Updates