Improve Your Trade is a fully-automated trading journal which records and tracks every trade you make automatically. It even adds screenshots of your trades, allowing you to focus on the important things like analyzing your trading performance!
OTM Volume Profile is essential to understand the auction behavior and find key price reaction zones, such as the VPO, high and low value area. This profile preserves and allows to visualize these levels historically, which distinguishes it from static profiles.
Eliminate noise with this indicator and identify long lasting and actionable trends with zero lag! It accurately visualizes trends and works on any chart type, detecting Bullish, Bearish and Neutral markets.
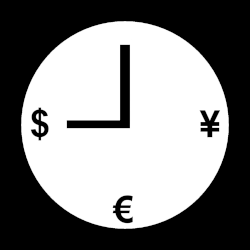
Track the open and close sessions of up to four different market times on your chart. A marker plots offset above and below the bar that corresponds to your time setting, which are all parameters that the user custom configures in the indicator properties window.
Quintalytics develops custom trading software for retail and institutional traders, brokers and other industry professionals for both NinjaTrader 7 and NinjaTrader 8. We have utilized and developed hundreds of custom indicators and trading strategies over 20 years. We can also modify and optimize.
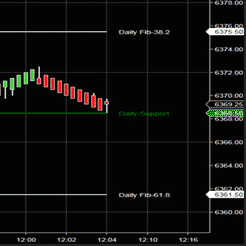
Trading123 Automatic Fibonacci Pivots draws the Fibonacci levels for you. No more second guessing as to where the price action is going. The Fibonacci levels move with the price action from one level to the next. Precise trading using price action for entries and exits at Fibonacci levels.
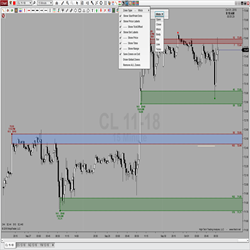
Creating, displaying & saving levels of interest could not be easier! Simply double click above or below any bar to automatically add or remove zones. This features 8 unique Zone Types, a right click context menu & toolbar icon for simple configuration, and is global drawing & template capable!
The StockCalcValuation indicator displays a fundamental valuation for the company you are examining. At StockCalc we value 8000 companies each night using 6 valuation models or data points and determine a Weighted Average Valuation from these calculations for display. Get your free trial now!
An indicator with automated entry notification along with entry, stop loss and profit target spot included.
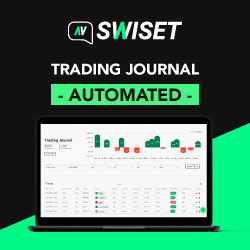
Quickly identify your best trading metrics on a 100% cloud-based journal. Starting from 0 USD, keep your track record automated with Swiset. Register now!
December 2, 2024
Mastering Sideways Markets With Auction Bars and Range Projections
November 19, 2024
Enhancing Your Automated Trading System: Key Insights from Best Pro Trade
November 14, 2024
NinjaTrader New Ecosystem Tools: October 2024 Edition
Enter Email for Updates