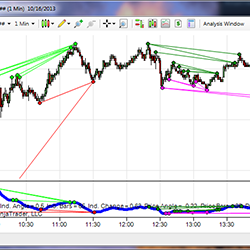
The Divergence Indicator for NinjaTrader utilizes a sophisticated algorithm to detect divergence, and eliminates some shortcomings of typical divergence indicators. It can be calculated using any indicator within NinjaTrader (ex. RSI, MACD, Stochastic, or any custom indicators).
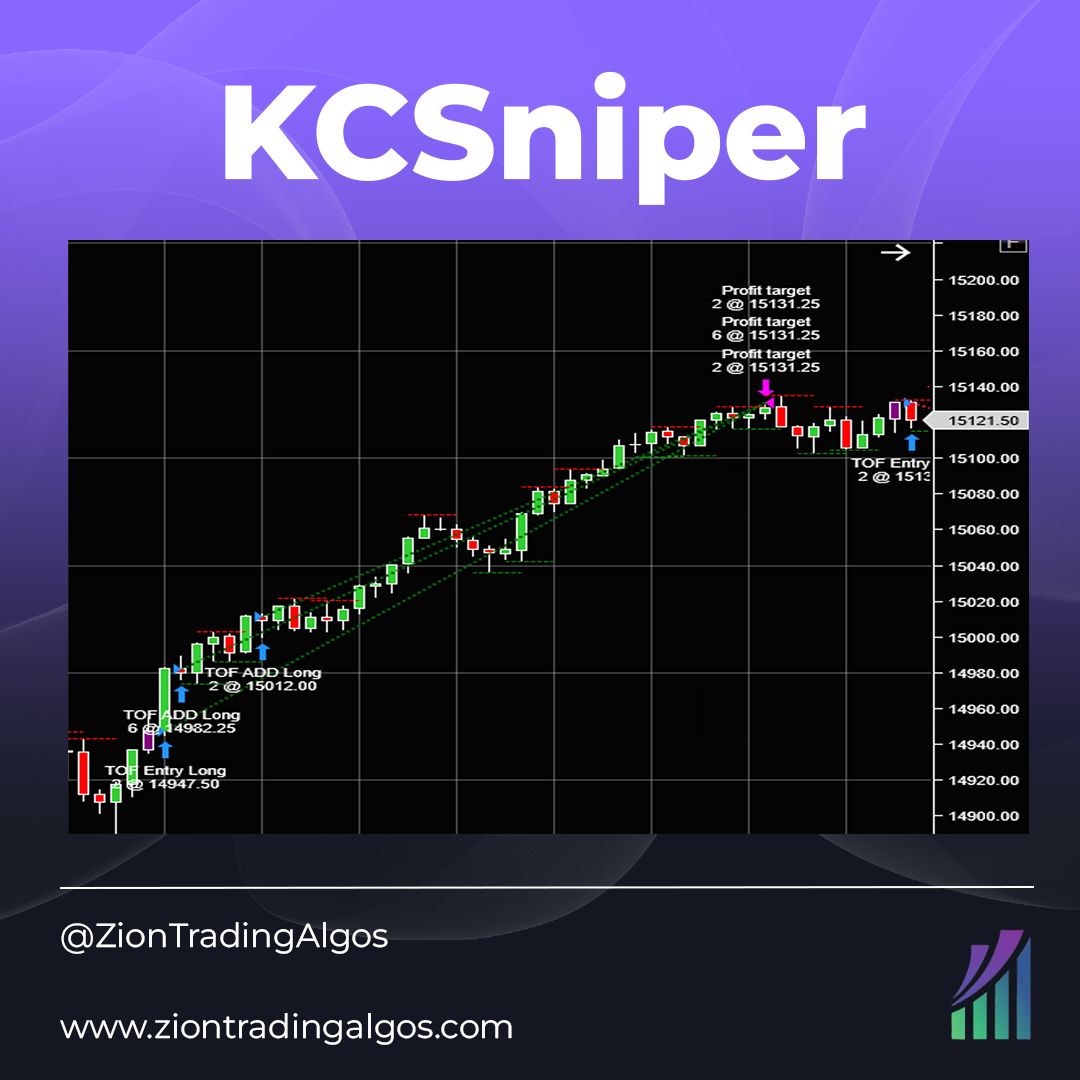
KCSniper is a Keltner Channel-based system on the 10-minute chart. It is long only and does not pyramid into positions, but has a single entry and exit model. It uses volatility based stop loss and take profit targets to remain adaptable. Trades MES and MNQ.
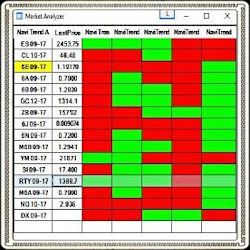
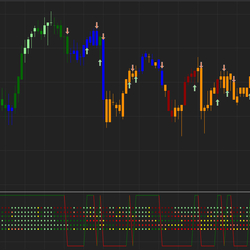
Utilizing pre-built indicators, the TrendFinder shows the probability of a market trend and price action continuation or termination, in real time. This Market Analyzer enhancement examines corresponding, short or long term and beginning or ending market trends with ease. Learn how!
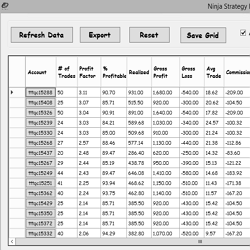
View strategy performance results calculated outside of the NinjaTrader platform. The Strategy Performance tool uses a CPU process separate from NinjaTrader to extract a detailed trade performance summary from Market Replay, Live or Simulated Trading.
These are some free indicators that can help you gain an easier and more informed understanding of your trades. Risk calculator, easy entry, volume bar and trend indicators all may help you to avoid mistakes.
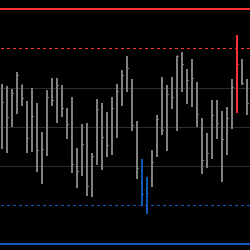
The Value Chart Indicator draws bars over a dynamically created scale from the last highest to the lowest values over a period. It attempts to spot market oversold and overbought areas on a short time scale, when price is most probable to revert to its mean.
Nordman Algorithms provides indicator and strategy programming services. Indicators for trend identification, trade zone detection, news impact calculation, price pattern visualization & more can be built, as well as extendable, maintainable systems that follow your trade strategy.
Join this team of professional traders and mentors as they identify trades in real time (US / open & close NQ & ES).
Quickly save and load sets of parameters in NinjaTrader. If you are tired of changing indicator and strategy parameters multiple times, SaveAndLoad adds a new system-wide feature for saving and loading any number of parameter sets, for indicators, for strategies, and for the Strategy Analyzer!
PriceIsKing.com's Forex RAM Indicator saves traders time finding entries and eliminates emotional factors. The algorithm is based on years of research and programming. This powerful tool shows entry points when the right condition is met. Get started with a free 2-week trial today!
March 25, 2024
Trading Pullbacks and Reversals: Simplifying a Once Complex Retail Trading Strategy
March 21, 2024
VWAP Indicator: Average Price Shown Based on Price, Volume
March 18, 2024
Trade Copier Strategies: Make Efficiency Work for You When Futures Trading
Enter Email for Updates