This is a basic but powerful email training course aimed at newbies who want to get started in the world of trading and need a solid base of knowledge to help them survive the early stages of this business and increase their chances of success.
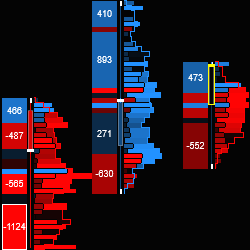
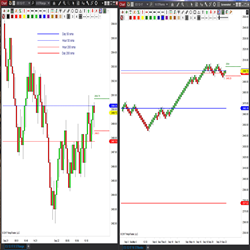
Delta Visualization System. Next-generation aggregate-able tick view of underlying order flow. Adaptive learning system highlights important price action. Bar and zone volume profile and Delta. Anchored VWAP and key Fibs. View Mini and Micro contracts on one chart. The edge you've been missing!
When MFI, RSI, and Stochastic converge, the background is colored, signifying the overlapping zone and triggering immediate alerts via chart markers. This visually appealing and efficient tool excels beyond conventional oscillator applications, optimizing chart space for essential information.
Q-ProTrader is a fully integrated day trading automated strategy which trades the E-mini futures contract. This package includes both the Q-ProTraderIndicator and Q-ProTraderStrategy.
Explore the vibrant world of NinjaTrader 8 Add Ons – a treasure trove of powerful tools crafted to elevate your trading game. Dive into an array of clocks, indicators and utilities designed to amplify your market analysis, fine-tune strategies and execute trades with precision.
The STMA indicator offers traders the ability to auto plot higher timeframe Simple or Exponential Moving Average’s on smaller time framed charts. Learn More about the STMA!
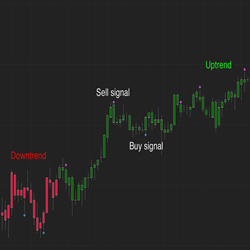
The Intentional Trader’s most popular "heads-up display" indicator. Get a signal when a confluence of order flow, price action, divergence and exhaustion indicate that price could pullback from the current trend. See this indicator in action with a five-day trading room free trial.
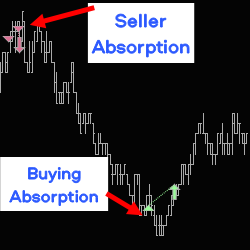
Absorptions are announced in real time with audible alerts and/or drawings on the chart. It also analyses backticking following absorptions. Adapt your trading zone live, with a toolbar on the chart. Strategy builder compatible.
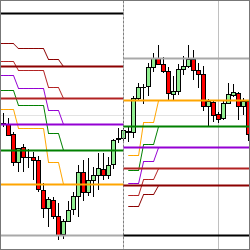
The Lucrum Fibonacci Retracement/Extension indicator is a tool that calculates the respective Fibonacci retracement levels based on the peaks and valleys of a range bound deviation indicator. Identify key price points to project future and past support and resistance levels.
Ocean Theory considers all time frames simultaneously, and lets the market tell you which ones have the most significance, since that changes with time. Determine trend, pinpoint end of counter-trend moves for optimal entries, and apply natural moving averages. Sign up for a 30 day free trial!
December 2, 2024
Mastering Sideways Markets With Auction Bars and Range Projections
November 19, 2024
Enhancing Your Automated Trading System: Key Insights from Best Pro Trade
November 14, 2024
NinjaTrader New Ecosystem Tools: October 2024 Edition
Enter Email for Updates