Expert Trading Programmers specializes in NinjaTrader indicators, strategies, add-ons, bar types, chart styles, drawing tools, performance metrics, and much more! Their products work on Futures, Forex and/or Stock markets. Get a free quote on your programming project now!
While similar to a Trailing Stop, this Ratcheting Stop script allows traders to set an initial Stop distance. You can also set how far the market needs to move before the ratchet gets activated, how far the Stop moves the first time and how far the Stop moves all subsequent times.
The purpose of this indicator is to automatically plot critical support and resistance levels on a chart. The Critical Support & Resistance Level Indicator comes with customizable alerts and can be added as a Market Analyzer column.
Discover top trading opportunities for US stocks, Wyckoff method analysis in US indices futures, Gold, Silver, market internals, and more to look for “time sensitive development” trading opportunities. Discuss your trading plans and past trade reviews to sharpen your price action trading skills.
Introducing the Multi Time Frame Moving Average to revolutionize your trading analysis. With this exceptional tool, you gain the ability to visualize a comprehensive array of moving averages derived from various time frames, bar types and average types, all conveniently displayed on a single chart.
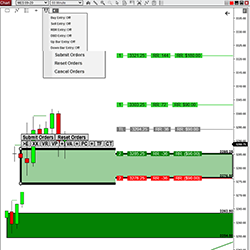
PFAHedger is an innovative addon to the PFAZoneSuite supply & demand indicator, providing the ability to submit hedging positions on any market. Simultaneously submit trades on any market while submitting hedge orders on another market, directly from the same chart.
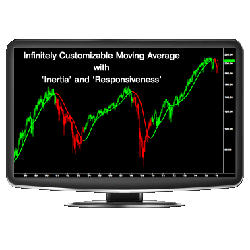
The ZMA™ is the most adaptable and customizable moving average indicator to date. By using an algorithm that incorporates the concepts of inertia, energy, and responsiveness, the ZMA is infinitely flexible and significantly more effective than other moving averages available.
The TradingFuturo Order Flow toolset consists of several advanced indicators which allow the technical analysis of markets through the Order Flow technique. It is robust and high-quality software, validated by a large community of traders.
The PSS Universal Trend System (PSSTrendSys) offers automated trading to capture forming trends in any market (stocks, futures & forex). Catch trends in any timeframe with the advanced low-lag Fast Trend indicator. Click here for a free 7-day trial, more info & performance samples!
Ichimoku MNTrader is a fully automated trading system. Trading is based on the Ichimoku Kinko Hyo indicator, patterns and zigzag to filter out false signals and build more accurate analysis. It uses Renko charts and is suitable for all futures and Forex trading instruments.
March 25, 2024
Trading Pullbacks and Reversals: Simplifying a Once Complex Retail Trading Strategy
March 21, 2024
VWAP Indicator: Average Price Shown Based on Price, Volume
March 18, 2024
Trade Copier Strategies: Make Efficiency Work for You When Futures Trading
Enter Email for Updates


/Universal-250x250.jpg)