If you're still guessing what tick speed to use as an intraday trader, stop now, and start using the Tickspeedometer. The indicator instantly reveals the correct tick chart setting for all instruments and timeframes throughout the trading session. So, stop guessing, & start trading with precision!
Turn your ideas into code! We work 1-on-1 with you to understand your needs and engineer a quality software solution that meets them. Automated strategies, indicators, data analytics, portfolio supervision – let us know your needs, we’re here to make it happen. Get in touch with us today!
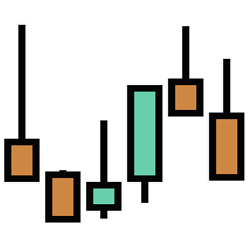
Delta Polar Bars are a new Order Flow bar type built on polarity between delta and volume. They finely distinguish balance/imbalance zones and produce specific intra-bar delta patterns which help to identify reversal/trend continuation.
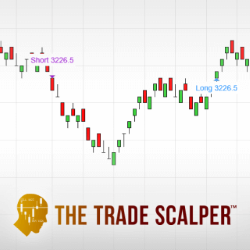
Use the Trade Scalper to pinpoint the exact moment you should place a scalping trade. What is scalping? Fast, in & out trading - multiple times per day. Included are both video and live training.
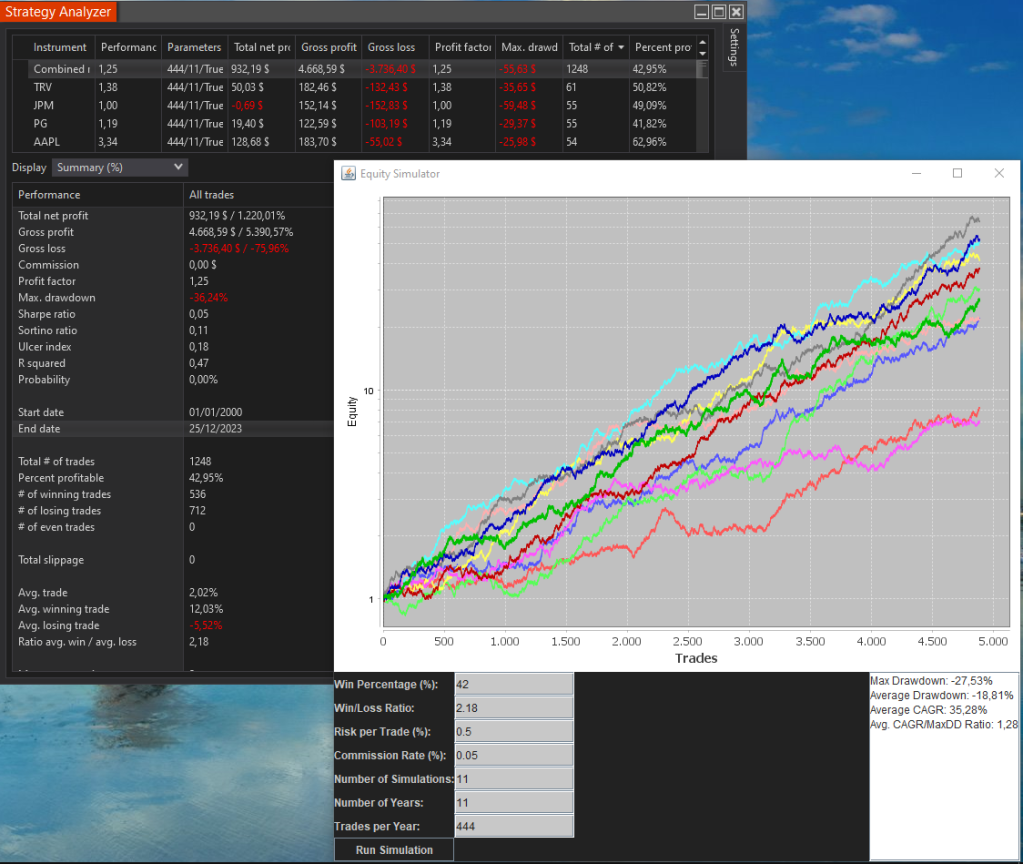
We can take the parameters from the Strategy Analyzer summary and generate a forecast for the desired numbers of trades and years. We can estimate our optimal risk per trade.
Choose from an assortment of indicators with enhancements not found anywhere else. (Digital Clock, Bar Timer, Divergence, Price Channel, Current Bar Range). Get free trials of these unique indicators now!
PriceIsKing.com's Forex RAM Indicator saves traders time finding entries and eliminates emotional factors. The algorithm is based on years of research and programming. This powerful tool shows entry points when the right condition is met. Get started with a free 2-week trial today!
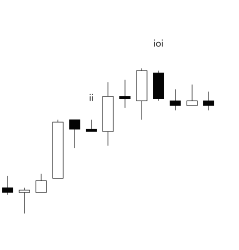
Breakout Mode Patterns from Brooks Price Action methodology.
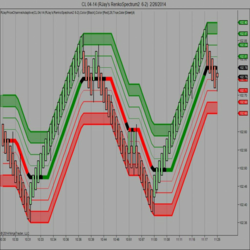
A trend following tool that can achieve exceptionally high risk/reward ratios when applied to suitable markets that trend well. Locks onto trends and does not let go until the trend ends. Not entirely suitable for novices. Strategy, paint bar and indicator included. Automated or manual operation.
The Volatility Bands indicator attempts to present a way to measure and visualize volatility, using standard deviations (σ) and average true range indicator, and aims to point out areas that might indicate potential trading opportunities. Click to learn more.
December 2, 2024
Mastering Sideways Markets With Auction Bars and Range Projections
November 19, 2024
Enhancing Your Automated Trading System: Key Insights from Best Pro Trade
November 14, 2024
NinjaTrader New Ecosystem Tools: October 2024 Edition
Enter Email for Updates