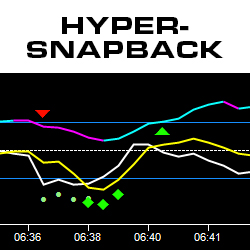
Based on an exclusive algorithm, the HyperSnapback indicator reads anomalies in price that are often difficult to spot in the market. It looks for specific predictive signals and offers trade management guidance. Get the HyperSnapback Indicator now!
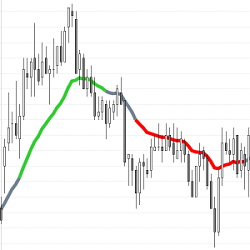
This indicator uses recent bar closes to calculate the “Always In” direction to help traders determine market trends. Use the Simple Always In EMA as a discretionary indicator or for automated trading. It is FREE to download and use!
The ROC/Wave Velocity is a bundled package with a momentum indicator including 10 types of averages with 3 oscillator inputs driven by 3 price options. It provides an added layer of discovery into the price action by measuring the acceleration/deceleration of price and the relative trajectory.
Trading requires edge, but in the new world of machine and algorithmic trading disrupting information processing and decision making, it’s incredibly elusive. Boss Trading addresses this problem by introducing professional experience and trader role modelling via live trading masterclasses.
EdsRetracePlan with Markers Plus added is a simple to use single indicator system for Ninja 8. Using 3 to 5 range charts, you can automate CL, NQ and GC trade entries by turning on Markers Plus. Trades will be taken using the long or short signals generated by ERP and then managed by Ninja 8 ATM.
A unique course with a specific, rule-based & mechanical/objective trading methodology. Designed to help traders identify entries & exits, define size, manage risk and control emotions when trading Equity Markets with their own characteristics & terminology. Get FREE access to the patented AutoUFOs®
This course, in French, details the step-by-step path to profitability, from the basics of trading to order flow, and the best known indicators. This course is the result of months of work and years of experience. Satisfied or your money back for 14 days – try it out!
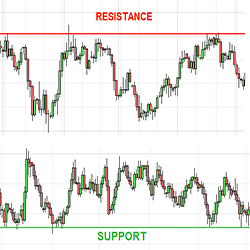
Plots chart and/or synthetic support and resistance lines from a higher time frame.
This is a NinjaTrader 8 Machine Learning Code for developers. Code is opensource and machine learning is done by the Naïve Bayes algorithm. Learning is based on trendlines, price change, volume and stochastics. Any input/data can be added to the learning process.
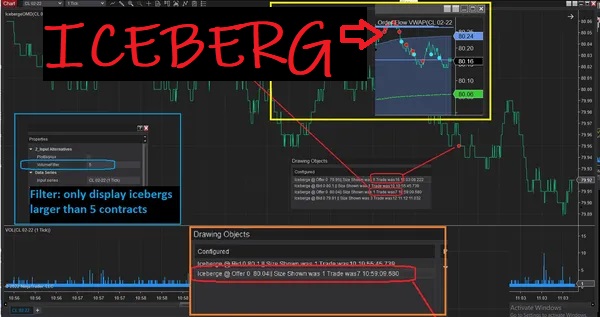
Detect sophisticated large traders, attempting to obfuscate their trading by only posting or displaying a portion of their order size. Indicator will highlight prices on a chart where iceberg was used and for how many contracts.
December 2, 2024
Mastering Sideways Markets With Auction Bars and Range Projections
November 19, 2024
Enhancing Your Automated Trading System: Key Insights from Best Pro Trade
November 14, 2024
NinjaTrader New Ecosystem Tools: October 2024 Edition
Enter Email for Updates