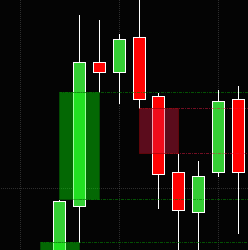
ICT's Fair Value Gap indicator retains a configurable number of gaps, and there's a setting to remove those that have been crossed by price. The style of the rectangle and the rays from the gaps are customizable by creating a template for a rectangle named "FVG Up Gap" (for the Up gaps).
Grab this FREE 10-page guide today! Discover little-known chart settings that will have a huge impact on your trading consistency.
With decades of experience, EMS specializes in the creation of custom software for clients worldwide. For over twenty-five years, EMS has been helping our clients reach their goals with honesty, integrity and fairness. Contact us for a complementary consultation.
This training, accessible to beginners and experienced users, explains step by step how to properly read the Orderbook and the Tape. At the end of the training, you will have all the knowledge and trading strategies necessary to be able to trade with confidence and logic on the markets.
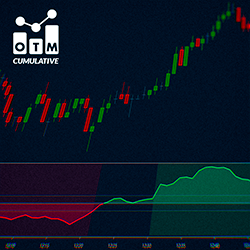
OTM Delta Cumulative is a histogram displaying delta behavior, measuring buying or selling strength. It helps identify trend transitions and clear trends. The curve direction shows the pressure difference between buyers and sellers, aiding informed market decisions.
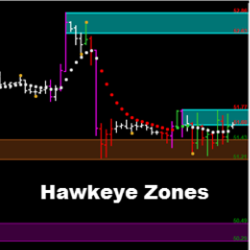
Hawkeye Zones add extremely accurate, predictive supply and demand zones (support and resistance) on your charts. Visualize market turning points and break out areas in all markets and timeframes. Buy now using code: “NT10Off” for a 10% discount.
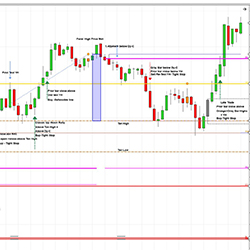
One-stop software for beginner & advanced traders. Proprietary intra-day structure & logic. Advanced time & price signals, custom built for ES, NQ & RTY. The markets opened 100 years ago with the same day timespan as today. See a NinjaTrader webinar free at DMIC2059.com. Use code NTW for a discount.
Do you want to overcome the challenges that leave traders feeling overwhelmed and uncertain? Have you tried to solve that losing pattern in your trading behavior but failed? This e-course, based on the latest neuroscience, will solve the mystery of your trading mind versus the collective market.
A traditional Gann Fan with 5 next-gen features to give your Gann analysis a new edge. This multi-timeframe Gann fan is what WD Gann himself would have created if he existed in today's fast paced digital landscape. A must to find support and resistance, real-time price momentum & geo signatures.
The Emet Trading Solutions team of experienced programmers specialize in converting existing indicators, strategies or code from cAlgo, MetaTrader, TradeStation & MultiCharts to NinjaTrader 7 or NinjaTrader 8. Get a free quote for your project today!
December 2, 2024
Mastering Sideways Markets With Auction Bars and Range Projections
November 19, 2024
Enhancing Your Automated Trading System: Key Insights from Best Pro Trade
November 14, 2024
NinjaTrader New Ecosystem Tools: October 2024 Edition
Enter Email for Updates