SniperTrader is a fully automated trading system that can reduce or completely remove the stress of day-to-day trading. It helps advanced or beginner traders with an easy plug-and-play function to set up and operate.
FXAN delivers a full approach that combines institutional tools, education, and professional support to help you trade with confidence. Their algorithms and training program have been developed by trading experts who’ve dominated markets for years.
Experience first-hand how Touch Zone Trading identifies opportunities & manages trades. Whether you’re trading part-time or full, you’ve got to be ‘in the zone’ to perform. Are you a good fit for the Touch Zone Trade Room? Take the trader survey!
The Stock Index Trading Room is a product of Robbins World Cup Champion Trader Rob Mitchell. It has a unique Scientific approach with Trading Signals, Indicator applications using Market Profile, Price Action, Order Flow, Momentum, Order Flow Momentum, Support Resistance, Market Mapping and more.
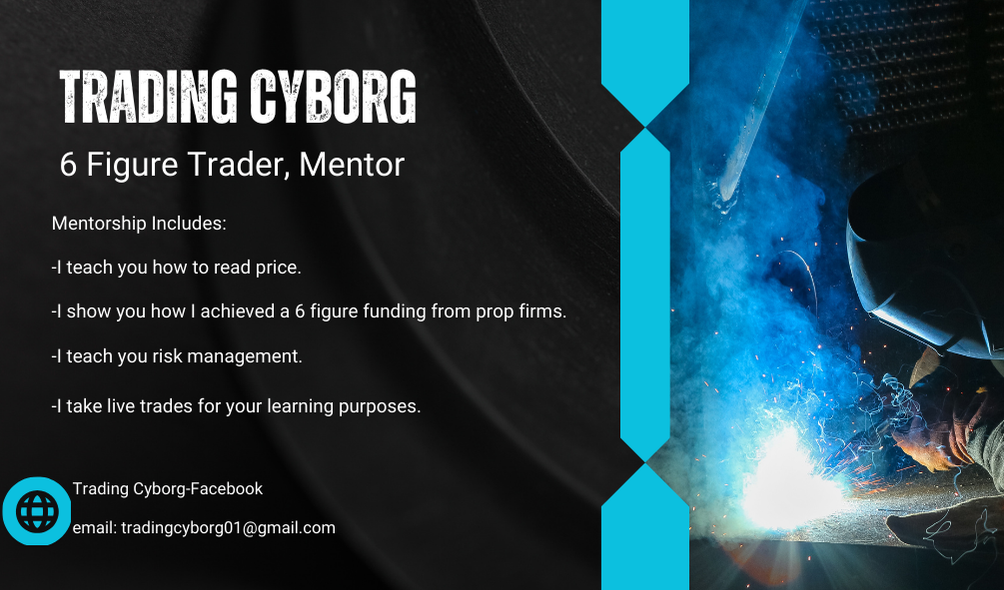
Learn how to manage 300k from FTMO through this detailed price action classes as well as live sessions. Learn the raw emotions involved in trading and how to manage those emotions.
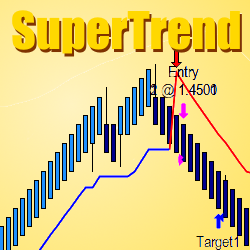
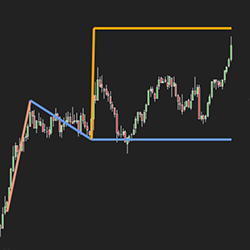
The TIS_Supertrend Indicator is a tool designed to trade volatile markets. The indicator produces 2 types of signals, a trend change arrow each time a trend line is broken and a pullback entry subsequent to the trend change. Download the TIS_SuperTrend today!
Every download will receive a 14-day Free Trial of the app on either Android or Iphone. You will be able to test the technology, analysis, trading signals and everything else at no cost. See how Forex Trading Unlocked can enhance your forex and futures trading. Gain trading consistency!
The VTP was created to provide Veterans with an introduction to financial markets. The Stage 5 Online Course educates traders on how to approach their funding challenges within the Prop Firm space. It aims to helping support traders to succeed, and build a sustainable trading business.
Measured moves are one of the most common trading strategies. However, they can be easy to miss. The Automated Measured Move Indicator from Tyche Trading takes away that difficulty, allowing you to focus on your trading. Never miss a measured move again. Get your seven-day free trial today!
Custom design. Custom actions. Create buttons that interact with standard NinjaTrader ATM strategy orders. Fully customizable, including button and font color and size as well as button width and position. Actions can be based on a wide variety of reference prices and offsets.
December 2, 2024
Mastering Sideways Markets With Auction Bars and Range Projections
November 19, 2024
Enhancing Your Automated Trading System: Key Insights from Best Pro Trade
November 14, 2024
NinjaTrader New Ecosystem Tools: October 2024 Edition
Enter Email for Updates