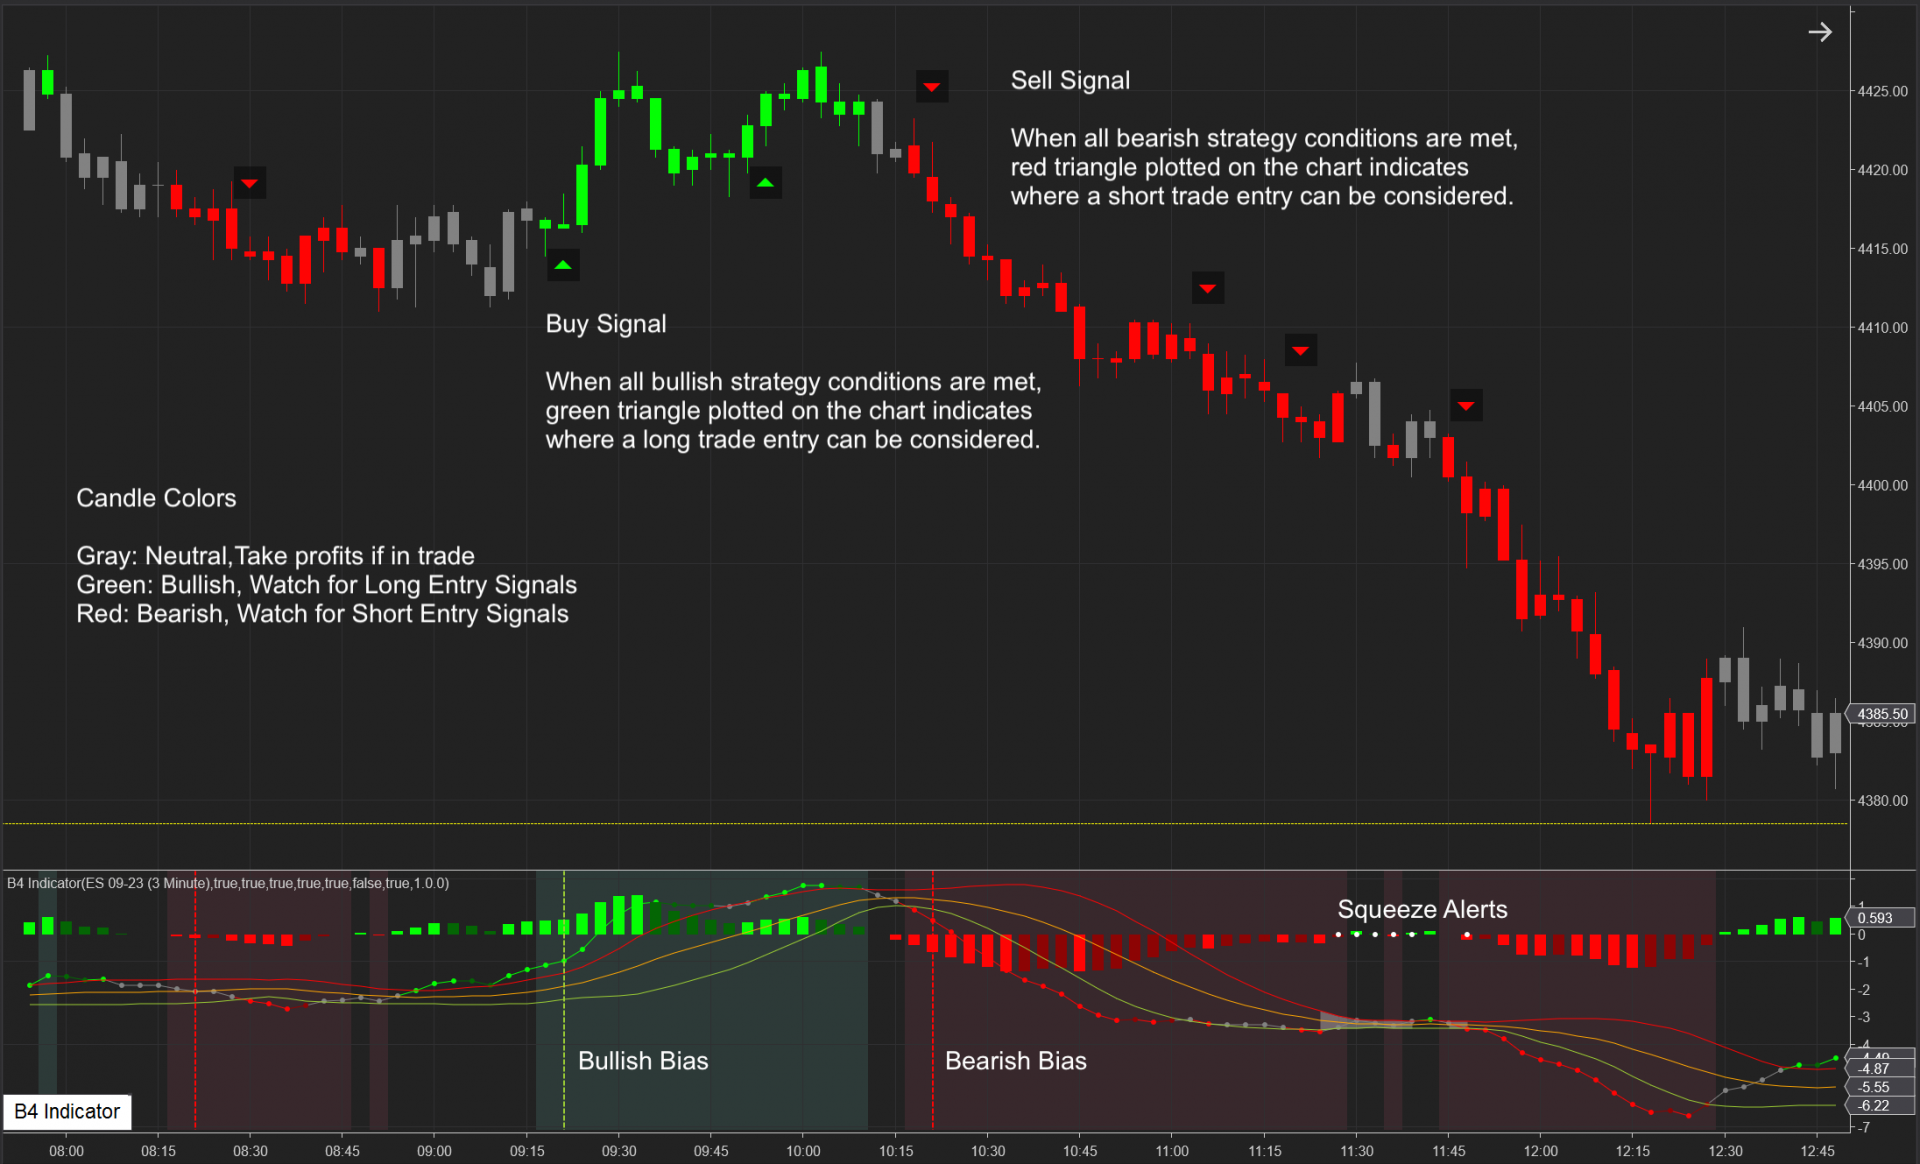
B4 Indicator is a trend and momentum indicator with buy and sell signals. Indicator background color shows the trend bias. Vertical lines show the trend confirmation. When all conditions are met, buy and sell signals are plotted on the chart. It also includes capabilities to detect market squeezes.
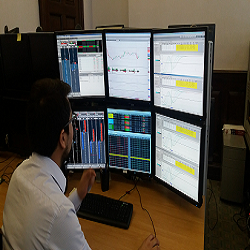
Actual Trading are professional traders and experts in market analysis, providing personalized training adapted to the needs of the customer. NinjaScript programming and development on demand. Exclusive indicators and systems for retail, professional, or institutional trading, and much more.
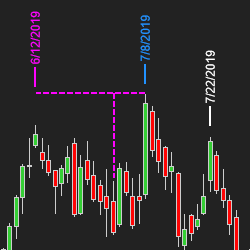
We focus primary on the time side of the markets using Fibonacci, Support and Resistance, Commodity Supply and Demand, Chart Geometric Patterns, Cycles, Seasonals and CoT Report.
Get Integrated Basic and Advanced Training in a full-year trader development program. This program includes access to live online Basic and Advanced Training events in addition to on-demand learning modules. Designed for those who can commit to 1-3 hours of trader development per day.
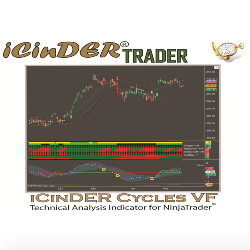
The iCinDER™ Cycles VF (Velocity Force) indicators allow for a quick validation of analysis, thus speeding up reaction time to market movement's bias. The analysis is based on velocity force of the instrument being analyzed.
Free daily newsletter - global news & views; free weekly YouTube (Sunday) to prepare you for the week ahead; 1-day workshops; 1-week courses zero to hero; accredited masterclass financial & commodity trading; flexi-masterclass, which includes a free trading challenge; and trader mentoring.
Backtest & forward test with the easy to use Strategy Tester. Develop your strategy for futures, forex, or equities markets. Test profit targets, stop placement, trading times, entries and exits in real time. This product includes unlimited support and a free class!
The only things traders can truly control are stop management and position sizing. Risk Manager works with any system or collection of indicators. It also provides the means for you to launch ATM strategy templates for better money management. Maintain great trade management with every trade!
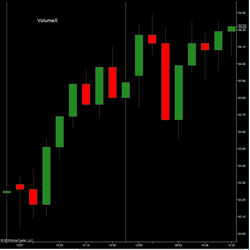
The LogikVolumeX utilizes signal processing and price reconstruction techniques to cut through the noise, reconstructing the true transaction, minimizing the hiding of large orders. This allows traders to identify & react to the market sentiment, and correlation between price & volume development.
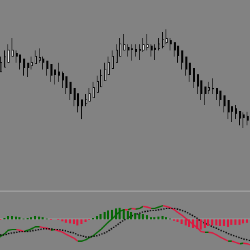
The EPyFMACD indicator has additional functionality such as Cross Color and UpDown, increasing the amount of visual information conveyed. The color and thickness of the EPyFMACD can also be customized.
December 2, 2024
Mastering Sideways Markets With Auction Bars and Range Projections
November 19, 2024
Enhancing Your Automated Trading System: Key Insights from Best Pro Trade
November 14, 2024
NinjaTrader New Ecosystem Tools: October 2024 Edition
Enter Email for Updates