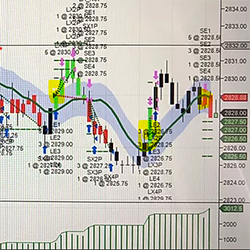
This custom tool is a buy sell short indicator that works in real time using price action, stats and probabilities. It has been used for many years by My Private Trader clients. It is very easy to use and provides high-probability signals.
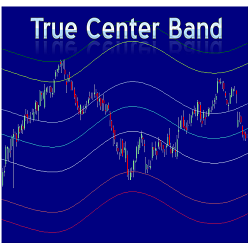
The True Center Band (TCB) indicator shows the trend, different levels of support and resistance and the boundary of price action. The TCB is designed to work on all intraday and daily charts as well as any market.
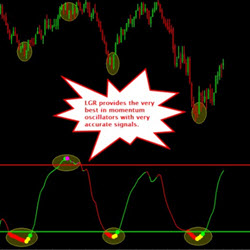
The LGR is a composite Triple Momentum Index Oscillator. LGR indicator is a proprietary design that gives the trader the crème de la crème of momentum oscillators by combining into a single indicator. No more figuring out which oscillator to choose.
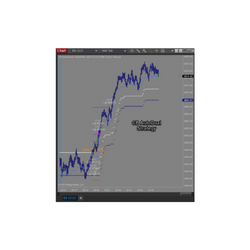
ClearAdapt ML showcases a unique automated deep learning model that fuses an intelligent and seamless system for optimal trade performance. The model works by extracting historical market data and takes on a rule-learning path for pattern recognition and trade entries; minimizing prediction error.
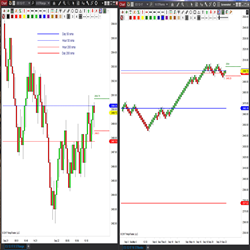
The STMA indicator offers traders the ability to auto plot higher timeframe Simple or Exponential Moving Average’s on smaller time framed charts. Learn More about the STMA!
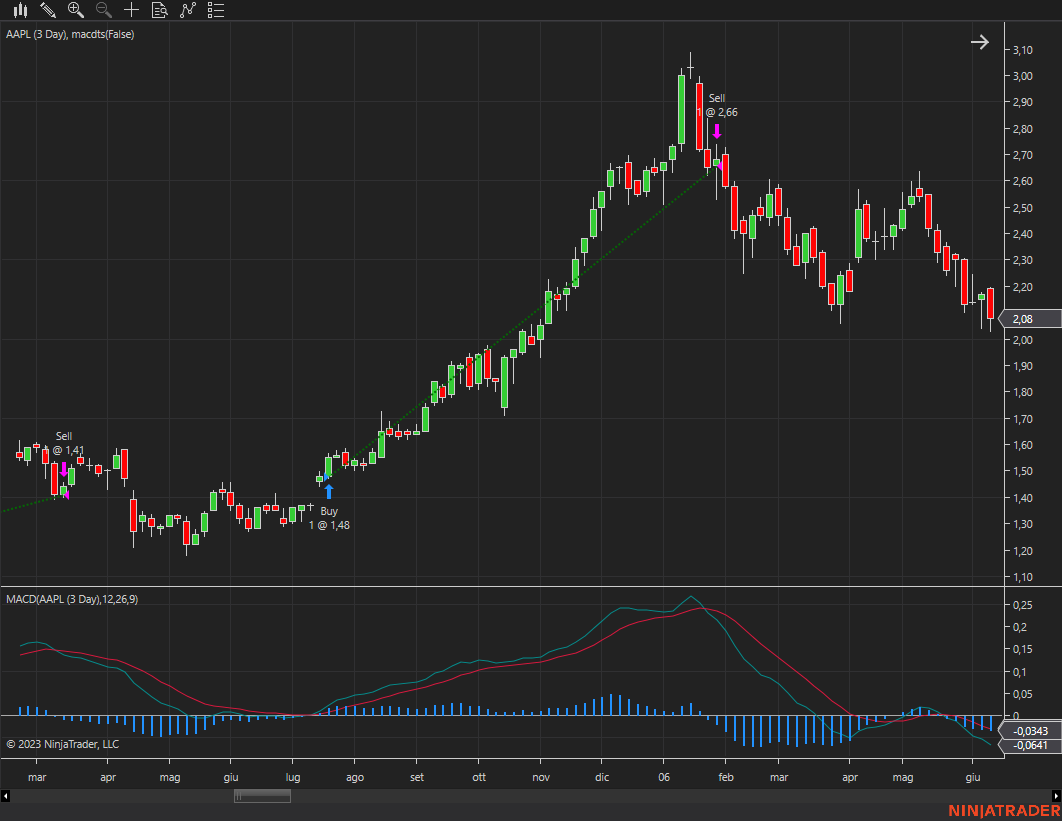
Trading system based on the MACD indicator, exploiting breakouts and trend persistence.
Ichimoku MNTrader is a fully automated trading system. Trading is based on the Ichimoku Kinko Hyo indicator, patterns and zigzag to filter out false signals and build more accurate analysis. It uses Renko charts and is suitable for all futures and Forex trading instruments.
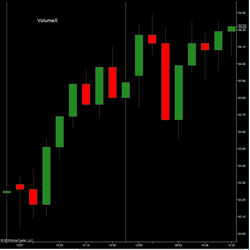
The LogikVolumeX utilizes signal processing and price reconstruction techniques to cut through the noise, reconstructing the true transaction, minimizing the hiding of large orders. This allows traders to identify & react to the market sentiment, and correlation between price & volume development.
This strategy is fully automatic with many inputs for backtesting. In today’s volatile market, it is not a standalone system. It was created to give the trader real, automated insights regarding money management, max trades per day, trailing stops, profit targets, etc. Now you can know.
On instruments with regular trading hours you often see gaps on a chart which stay open for more than a day. A couple of times a month these open gaps from prior days also play an obvious role as support or resistance on the intraday chart. These tools are free to download and use!
December 2, 2024
Mastering Sideways Markets With Auction Bars and Range Projections
November 19, 2024
Enhancing Your Automated Trading System: Key Insights from Best Pro Trade
November 14, 2024
NinjaTrader New Ecosystem Tools: October 2024 Edition
Enter Email for Updates